
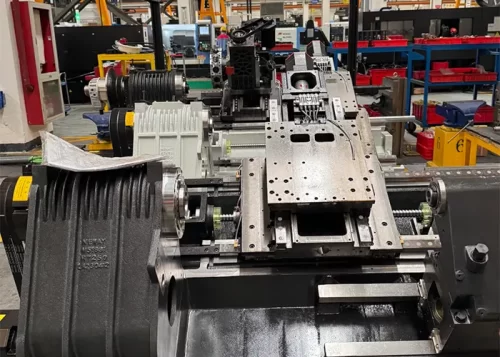

Currently, the traceability of precision in high-end CNC machine tools is shifting from component manufacturing to assembly and integration.
The spatiotemporal coupling and propagation of multiphysics errors—such as deviations in mating surface stiffness, preload errors, and thermal deformation—within the assembly process chain are the core causes of precision degradation and performance fluctuations in the entire machine.
This paper provides an in-depth analysis of the mechanisms underlying multi-source error propagation and explores a new real-time, data-driven closed-loop assembly approach, offering theoretical support and a technical pathway for transforming machine tool assembly from a “craft” to a “science.”
A Key Technology Framework for Closed-Loop Assembly Incorporating Online Inspection
To overcome the bottleneck of “unobservable and uncontrollable” error propagation pathways in traditional assembly models, this study has established a technology framework capable of shifting the quality control of key functional components from post-assembly inspection to in-process control.
Through real-time monitoring of key physical parameters during the assembly process, data analysis, and proactive intervention, the framework achieves precise suppression of multi-source errors.
Online Monitoring of Spindle System Rotational Accuracy and Closed-Loop Dynamic Balancing
1. Dynamic Imbalance Mechanism of High-Speed Electric Spindle
For electric spindles operating at speeds exceeding 8,000 r·min⁻¹, the slender shaft structure not only exhibits static imbalance caused by the center of mass being offset from the axis of rotation, but is also more prone to couple imbalance (a type of dynamic imbalance) resulting from the misalignment between the inertial axis and the geometric axis.
This couple imbalance torque excites the spindle’s conical vibration mode, causing severe angular oscillation at the tool tip and significantly degrading the surface quality of the machined part.
2. In-Situ Double-Sided Dynamic Balancing Method Based on Influence Coefficient Method
Therefore, this study employs an in-situ double-sided dynamic balancing technique based on the influence coefficient method.
Researchers mount two sets (four in total) of high‑frequency (>10 kHz) eddy‑current displacement sensors perpendicularly near the spindle’s front and rear bearings to perform simultaneous non‑contact measurement of radial vibration displacement at the two calibration planes.
The Z-phase pulse signal from the spindle encoder serves as a precise phase reference, ensuring that the vibration signals correspond accurately to the rotational phase.
The entire closed-loop calibration process is as follows: acquire the initial vibration vector A0 at the target rotational speed;
Apply a known test mass T1 to the front calibration plane P1, then run the spindle to the target rotational speed and measure the new vibration vector A1;
Remove T1, apply a test mass T2 at the rear calibration plane P2, and measure the vibration vector A2.
Using these three sets of data, the system’s influence coefficient matrix α is precisely established, expressed as

This matrix quantitatively characterizes the linear coupling relationship between changes in the mass of the front and rear correction planes and the vibration responses of the front and rear measurement planes.
Ultimately, the correction mass vector U (which includes the correction masses and angles of the front and rear planes) required to offset the initial imbalance A0 can be obtained by solving the system of linear equations A0 + αU = 0.
3. Error Analysis and Accuracy Optimization
To ensure calibration accuracy, this study analyzed key sources of error.
When a sensor mounting angle deviation ∆ϕ is present, orthogonal coupling errors arise within the measurement plane.
If the actual angle between the orthogonal measurement directions X and Y is 90°–∆ϕ, the relationship between the measured amplitude A’ and the true amplitude A’ is given by

In the equation: R is the rotation transformation matrix. When ∆ϕ reaches 2°, the calculated correction mass error for a 1 μm vibration can reach 15%.
To suppress this error, a dedicated high-precision sensor mounting bracket was designed and calibrated using a coordinate measuring machine to ensure that ∆ϕ < 0.5°, thereby controlling the correction uncertainty introduced by this error source to within 5%.
By adopting this double-sided balancing technique, this study limits the spindle’s dynamic rotational runout to within 1.5 μm at a speed of 10,000 r·min⁻¹.
This method effectively suppresses conical vibration under high-speed operation and guarantees dynamic machining accuracy for low-surface-roughness machining.
Direct Measurement and Closed-Loop Control of Feed System Preload
The ball screw assembly serves as the core transmission component of a feed system.
The axial preload of its support bearings has a decisive impact on the system’s transmission stiffness, positioning accuracy, and service life.
Traditional assembly methods commonly employ the torque method;
However, due to significant interference from various uncertainties—such as the friction coefficient of the screw-nut pair, lubrication conditions, and the state of the contact surfaces—it is difficult to achieve precise and consistent control of the preload.
To address this challenge, this study proposes and implements a closed-loop control assembly scheme based on direct measurement of axial force.
This study adopts a high-stiffness annular piezoelectric thin-film force sensor and precisely integrates it into a custom locking nut assembly at the lead screw’s bearing end.
The selected sensor features high sensitivity, high linearity, and high stiffness, thereby avoiding significant impacts on the mechanical characteristics of the assembly system itself. Its key performance indicators are shown in Table 1.
| Performance Parameter | Unit | Value | Remarks |
|---|---|---|---|
| Measurement Range | kN | 0–5 | Covers the bolt preload requirements of most small and medium-sized machine tools. |
| Sensitivity | pC·N⁻¹ | 4.5 | — |
| Linearity Error | %F.S. | ≤ 0.3 | Full-scale error |
| Repeatability Error | %F.S. | ≤ 0.2 | Full-scale error |
| Axial Stiffness | N·μm⁻¹ | > 1,500 | Ensures the sensor has minimal influence on the stiffness of the assembled system. |
| Operating Temperature | °C | −20 to 80 | Suitable for workshop assembly environments. |
| Natural Frequency | kHz | > 40 | Excellent dynamic response performance. |
Table 1. Key Performance Specifications of a Piezoelectric Thin-Film Force Sensor
During the assembly process, when the operator tightens the lock nut, the actual axial preload applied to the angular contact ball bearing acts directly on the sensor, causing it to generate a faint electrical signal that is precisely linear with the applied force.
This signal is then conditioned and amplified by a built-in charge amplifier, converted to a digital value via a high-precision analog-to-digital converter, and finally fed back as a real-time, precise force value in newtons (N) to the assembly monitoring terminal.
Consequently, the assembly process has shifted from the previous indirect open-loop control method—which relied on torque wrench readings and operator experience—to a data-driven direct closed-loop control system.
Global Closed-Loop Control of the Assembly Process Based on Multi-Sensor Information Fusion
The precision assembly of CNC machine tools is a complex process involving strong coupling among multiple physical fields, including geometry, mechanics, and thermodynamics.
To address this, this study developed a global control system for the assembly process based on multi-sensor information fusion, enabling global monitoring and coordinated intervention in the error propagation chain.
The system integrates heterogeneous sensor data streams from various assembly stages:
Macroscopic geometric accuracy data for major components such as guideways and worktables, provided by a laser interferometer; local assembly stress data—such as bearing preload—feedback from piezoelectric sensors integrated into the lead screw and nut; dynamic rotational accuracy information of the spindle, acquired by eddy current displacement sensors;
And information on internal stress distribution and temperature fields within the structure, provided by multiple strain gauges and thermocouples installed beneath critical mating surfaces such as the bed and column.
The goal of information fusion is to reveal the intrinsic relationships between different physical quantities, thereby identifying potential assembly defects.
The entire control logic follows a data-driven closed-loop feedback process, as shown in Figure 1.
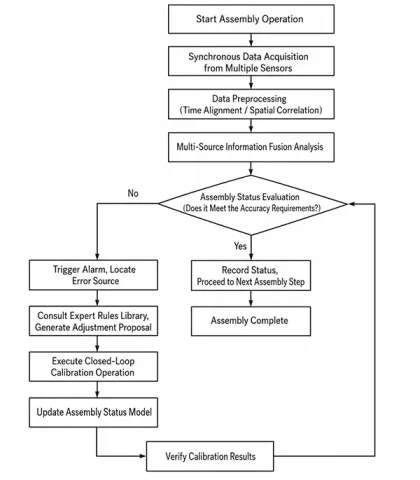
During any critical assembly step, the system simultaneously collects real-time data streams from various sensors and performs rigorous time-stamp alignment and spatial position correlation.
The central fusion and analysis module feeds this multidimensional data into a pre-established assembly state space model to evaluate, in real time, the impact of the current assembly operation on the overall geometric accuracy and mechanical stability of the finished product.
In this way, the system is able to suppress assembly errors at their source, enabling intelligent control and management of the precision assembly process.
Experimental Design and Results Analysis
Experimental Design for Multi-Machine Type Comparison and Assembly Accuracy Verification
To verify the universality and effectiveness of the proposed precision assembly technology, this study selects three typical machine tools with distinct structural differences as experimental subjects.
The VMC-850 vertical machining center (representing a medium-sized, high-rigidity structure), the HMC-630 horizontal machining center (representing a complex, multi-axis box-type structure), and the GMC-2515 gantry machining center (representing a large-span, long-stroke structure).
For each machine type, this study selects 20 unassembled units and randomly divides them into two groups.
The control group (Group A) employed traditional assembly processes involving manual scraping, feeler gauge tool setting, and torque wrench-based torque setting;
The experimental group (Group B) applied the online inspection and closed-loop calibration technology system throughout the entire process.
This study tests the key accuracy metrics of machine tools in both groups, focusing on the full-stroke positioning accuracy and repeatability of each axis, as well as the spindle dynamic rotational error at the maximum speed.
The results are shown in Table 2.
| Machine Model (Type) | Group | X-Axis Positioning Accuracy (mm) | Y-Axis Positioning Accuracy (mm) | Z-Axis Positioning Accuracy (mm) | X-Axis Repeatability (mm) | Y-Axis Repeatability (mm) | Z-Axis Repeatability (mm) | Spindle Dynamic Runout (μm) |
|---|---|---|---|---|---|---|---|---|
| VMC-850 (Vertical) | Group A | 0.012 | 0.012 | 0.010 | 0.006 | 0.006 | 0.005 | 4.8 |
| Group B | 0.007 | 0.007 | 0.006 | 0.003 | 0.003 | 0.003 | 1.5 | |
| HMC-630 (Horizontal) | Group A | 0.015 | 0.014 | 0.012 | 0.007 | 0.006 | 0.006 | 5.2 |
| Group B | 0.009 | 0.008 | 0.007 | 0.004 | 0.003 | 0.003 | 1.8 | |
| GMC-2515 (Gantry) | Group A | 0.022 | 0.020 | 0.015 | 0.010 | 0.009 | 0.007 | 5.5 |
| Group B | 0.012 | 0.011 | 0.008 | 0.005 | 0.005 | 0.004 | 2.1 |
Table 2. Comparison of Key Accuracy Indicators of Machine Tools Under Different Assembly Processes (Average Values)
As shown in Table 2, compared with traditional processes, the Group B machine tools utilizing the new technology demonstrated significant improvements across all precision metrics.
Notably, for the error-sensitive GMC-2515 gantry machining center, real-time closed-loop correction of long-guideway parallelism based on laser interferometer measurement improves the positioning accuracy of its long-stroke X-axis by over 45%.
Moreover, Group B exhibits a distinctly lower data standard deviation than Group A.
This demonstrates that substituting manual experience-dependent judgment with sensor-based quantitative feedback not only improves the standalone machining precision of individual machine tools but also effectively suppresses assembly quality fluctuation.
This demonstrates that the technology possesses excellent universality and engineering value in the manufacturing of machine tools with different configurations.
Analysis of Long-Term Operational Stability and Accuracy Retention
1. Experimental Setup and Monitoring Conditions
To evaluate the long-term performance of the proposed precision assembly technology in practical production scenarios, this study conducts a 12-month on-site monitoring experiment on the three aforementioned machine models, with 10 machine units assigned to Group A and Group B for each model.
During the entire test period, all machine tools operated under standard-load cutting conditions.
The investigation focused on the accuracy stability evolution induced by interfacial stress variation at assembly joints under the coupling effects of long-term cutting forces, thermal loads, and environmental vibration disturbances.
2. Comparative Analysis of Long-Term Accuracy Degradation Characteristics
Monitoring data indicate that the Group A machines, assembled using traditional methods, generally exhibited accuracy degradation after approximately 6 months of operation.
This phenomenon stems from localized fretting wear induced by bolt preload fluctuations in conventional assembly processes, as well as structural creep driven by residual stress release.
In comparison, Group B machine tools equipped with digital precision assembly technology exhibit superior accuracy degradation resistance.
This benefit stems from the stable control of contact stiffness at mating surfaces and the homogenization of internal stresses throughout the assembly procedure.
On the GMC-2515 gantry machining center—a machine with a large structural span that is sensitive to deformation—digital assembly technology effectively suppressed microscopic slippage at the connection between the bed and the column.
The evolution of accuracy metrics for each machine model before and after long-term operation is shown in Table 3.
| Machine Model (Type) | Group | Initial Positioning Accuracy (mm) | Final Positioning Accuracy (mm) | Accuracy Retention (%) | Initial Spindle Vibration (mm·s⁻¹) | Final Spindle Vibration (mm·s⁻¹) | Mean Time Between Failures (MTBF) (h) |
|---|---|---|---|---|---|---|---|
| VMC-850 (Vertical) | Group A | 0.16 | 0.25 | 64.0 | 0.85 | 1.42 | 1,150 |
| Group B | 0.09 | 0.10 | 90.0 | 0.45 | 0.52 | > 2,000 | |
| HMC-630 (Horizontal) | Group A | 0.20 | 0.32 | 62.5 | 0.92 | 1.65 | 980 |
| Group B | 0.11 | 0.12 | 91.7 | 0.48 | 0.58 | 1,950 | |
| GMC-2515 (Gantry) | Group A | 0.29 | 0.47 | 60.7 | 1.10 | 1.95 | 850 |
| Group B | 0.15 | 0.17 | 88.2 | 0.55 | 0.68 | 1,820 |
Table 3. Comparison of Machine Tool Accuracy Retention and Stability After Long-Term Operation (12 Months)
3. Quantitative Result Verification and Mechanism Discussion
Analysis of Table 3 reveals that the geometric accuracy retention rate of Group B machines remained stable at over 85% throughout their entire lifecycle, significantly outperforming the approximately 60% level of Group A.
Meanwhile, in terms of spindle vibration indicators that characterize dynamic stability, Group B machine tools exhibited only a minor rise in steady‑state vibration amplitude, which stayed within the optimal range.
By contrast, Group A machines suffered aggravated vibration resulting from dynamic balancing failure, with vibration levels approaching the alarm threshold.
This further confirms that multi-source error online closed-loop control not only improves the initial factory accuracy of machine tools but also remarkably prolongs their trouble-free operation cycle by stabilizing the mechanical assembly state.
The findings validate the long-term reliability of the proposed technology under complex working conditions.
Comprehensive Assessment of the Impact of Assembly Accuracy on Machining Performance
Assembly accuracy ultimately depends on the actual cutting performance of the machine tool.
To quantify the specific effects of the proposed technology on machining quality and efficiency, this study performs high-speed cutting experiments on 7075 aluminum alloy S-shaped specimens using a VMC-850 machining center, complying strictly with the national standard GB/T 39967—2021, Accuracy Testing of S-Shaped Test Specimens for Five-Axis Machining Centers.
The experiments focused on machined surface quality, geometric and positional errors, and extreme cutting capability; the comparative results are shown in Table 4.
| Performance Metric | Test Condition | Group A (Conventional Assembly) | Group B (Precision Assembly) |
|---|---|---|---|
| Surface Roughness (Ra) | Finish milling; Spindle speed: 8,000 r/min | 0.78 μm | 0.32 μm |
| Workpiece Roundness Error | Circular interpolation; Feed rate: 2,000 mm/min | 5.2 μm | 1.5 μm |
| Process Capability Index (Cpk) | Critical dimensions in mass production | 1.12 | 1.67 |
| Maximum Depth of Cut | Rough milling; Chatter-free threshold | 3.5 mm | 5.0 mm |
Table 4. Comparison of Machine Tool Cutting Performance Under Two Assembly Processes
As illustrated in Table 4, effective suppression of spindle dynamic imbalance enables Group B machine tools to substantially eliminate high-frequency vibration textures on machined surfaces, resulting in surface roughness (Ra) that stably meets precision-grade standards.
Meanwhile, closed-loop preload control of the feed system effectively enhances transmission stiffness.
For Group B machine tools, this improvement increases the maximum cutting depth by 1.5 mm in rough machining and substantially elevates the material removal rate.
Furthermore, the prominent enhancement of the process capability index verifies that the elimination of assembly error transmission endows machine tools with superior consistency and stability during high-volume production.
This fully validates the decisive contribution of the proposed precision assembly technology to final machining quality improvement.
Conclusion
This study confirms that deeply integrating online inspection and closed-loop control into the entire assembly process enables precise suppression of multi-source errors and systematic optimization of assembly quality.
This technical framework exhibits excellent adaptability to machine‑tool equipment with diverse configurations.
By enhancing precision retention and machining process capability, it remarkably prolongs the effective service life of machine tools.
Accordingly, it delivers a practically viable process scheme to promote the digital‑intelligent transformation of high‑end equipment manufacturing.