


Harsh ocean environments set strict requirements for offshore engineering materials. Qualified candidates need strong mechanical strength, corrosion resistance, and fatigue tolerance.
High-Speed Machining of 7075 Aluminum Alloy
7075 aluminum alloy delivers outstanding strength and fatigue performance. Manufacturers deploy this high-strength alloy in many marine facilities.
Typical applications cover offshore platforms, FPSO units and deep-sea exploration gear. The alloy maintains reliable structural strength and cuts equipment weight markedly.
Lighter hardware lifts buoyancy and reduces overall energy consumption. Marine service exposes these alloy components to multiple destructive factors.
Long-term operation subjects structures to complicated marine mechanical loads. Electrochemical, mechanochemical and biochemical corrosion also attack the material.
Combined effects create tough tests for corrosion protection of aerospace aluminum alloys.
Machining Challenges and Previous Research
During the machining of marine engineering equipment, cutting processes are commonly employed.
For aluminum alloys, machining typically involves flushing or dry cutting, and numerous experts and scholars have researched their machinability.
Niu Zhanhao and his team adopt ABAQUS for finite element simulation. They build a turning model for GH4169G superalloy machining.
Tests explore two groups of influencing factors. Cutting parameters and tool geometric shapes alter cutting force and cutting heat.
The results showed that as the cutting depth increased, the cutting temperature first rose rapidly and then rose more slowly, but overall remained in a state of rapid increase.
Researchers track temperature variation rules in this follow-up exploration. Cutting settings and tool geometric angles jointly shape thermal output.
Comparative trials screen out the most suitable parameter combinations. These optimized angles and cutting variables deliver superior machining outcomes.
Collected conclusions support later parameter tuning for cutting operations. Guo Xiuli’s team carries out high-speed machining trials on TC4 titanium alloy.
Cooling and Lubrication Methods in High-Speed Machining
Three cooling-lubrication schemes serve as test backgrounds: CMQL, cold air, and flood cooling. Workers run roughing, semi-finishing and finishing tests under four distinct lubrication environments.
Extra orthogonal cutting tests focus on CMQL treatment alone. Single-factor analysis and orthogonal design reveal how working conditions change machining performance.
Test data confirm the strengths of CMQL cooling and lubrication. This technique lowers cutting resistance during high-speed processing.
It also improves surface roughness on finished parts. Benefits stand out clearly in high-speed finish turning procedures. Production efficiency guides the final parameter selection for CMQL machining.
Balanced settings adopt a relatively high cutting speed. Operators keep finishing allowances small within safe limits. Matching feed rates rise to a reasonable upper bound.
However, flood cutting results in excessive coolant consumption, while dry cutting provides inadequate cooling.
In contrast, low-temperature minimal-quantity lubrication cutting effectively addresses these issues by significantly reducing the temperature in the cutting zone while maintaining effective lubrication performance;
This plays a crucial role in improving workpiece quality and demonstrates unique advantages.
Research on Low-Temperature Minimal-Quantity Lubrication for 7075 Aluminum Alloy
Three lubrication schemes form the basis of this exploration.
Selected options include dry cutting, minimal-quantity lubrication and low-temperature minimal-quantity lubrication.
Engineers take 7075 aluminum alloy as the machining object. Test groups examine how cutting parameters change its machining performance.
The research findings will provide technical guidance and theoretical support for the high-speed machining of 7075 aluminum alloy.
Experimental Materials and Methods
Experimental Materials
The material selected for the experiment was 7075-T6 aluminum alloy. Technicians use an SX2-2.5-10 box-type resistance furnace for heat treatment.
Raw 7075 aluminum alloy samples sit inside this furnace. The equipment raises the temperature to 475 °C together with the workpiece.
Samples stay at this peak temperature for one hour. Cold water delivers rapid quenching after the soaking stage.
A second heating cycle follows the quenching step. The furnace reheats specimens to 140 °C. Twelve hours of heat preservation complete the aging process. Operators take samples out afterward.
Natural air flow cools these parts down to ambient temperature.
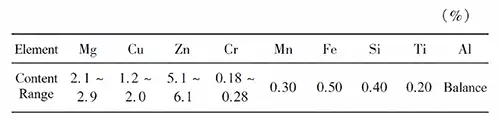
An X-ray energy dispersive spectrometer (XRD) was used to analyze the chemical composition of the surface of the heat-treated 7075-T6 aluminum alloy specimens, as shown in Table 1.
Experimental Protocol
Dry cutting, minimal-quantity lubrication (MQL), and low-temperature MQL form the test conditions. This study explores machining performance on 7075-T6 aluminum alloy.
Selected variables cover cutting speed, cutting depth, and feed rate. Collected results reveal how these parameters change the alloy’s machinability.
The material selected for this study is 7075-T6 aluminum alloy, with dimensions of 10 mm × 10 mm × 10 mm.
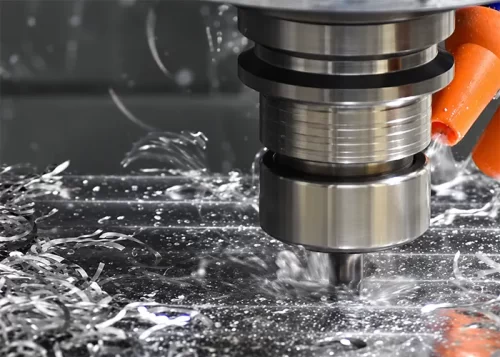
In the main cutting experiments, a Mitsubishi MV820 CNC machine tool was used for high-speed cutting. The machine tool has a maximum spindle speed of 8,000 r/min.
An 80-mm-diameter cutter head was selected for the experiments, equipped with APMT1604PDER-H2 inserts. Minimal quantity lubricant and ultra-low-temperature liquid nitrogen were supplied by external equipment.
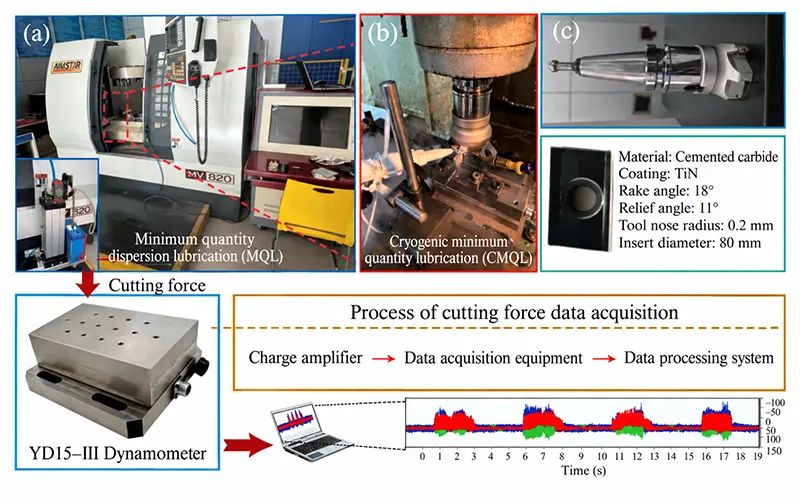
The experimental machine tool setup is shown in Figure 1. A YD15-111 force gauge was used to measure cutting forces during the experiments.
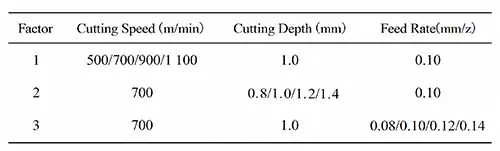
Cutting speed, cutting depth, and feed rate were selected as the variables of interest, and a single-factor experimental design was employed, as shown in Table 2.
Cutting experiments were conducted under three lubrication conditions: dry cutting, minimal quantity lubrication (MQL), and low-temperature liquid nitrogen MQL.
For minimal-lubrication cutting, a pneumatic atomizing minimal-lubrication device was used as the lubricant supply unit, as shown in Figure 1a.
A vegetable-based lubricating oil was used as the cutting fluid, with a flow rate of 50 mL/h.
Low-temperature minimal-quantity lubrication cutting involves adding ultra-low-temperature liquid nitrogen as a cooling medium to the minimal-quantity lubrication cutting conditions;
The temperature of the ultra-low-temperature liquid nitrogen is -196 °C.
The minimal-quantity lubrication nozzle and the low-temperature medium nozzle are shown in Figure 1b.
Characterization Methods
Surface roughness (Ra) was measured using a Bruker X-300 white-light interferometric optical profilometer. While measuring surface roughness, the three-dimensional topography of the machined surface was also captured.
Five measurements were taken under identical conditions, and the average value was calculated to obtain a more accurate Ra value.
Researchers adopt a Hitachi TM4000plus scanning electron microscope (SEM). It captures surface features on machined 7075 aluminum alloy samples. Observation targets surface defects under varied MQL settings.
An EDS spectrometer works alongside the microscope. Operators run elemental analysis on these finished alloy surfaces.
An Xstress 3000 X-ray stress analyzer was used to measure residual stresses in the surface and subsurface layers. For residual stresses along the depth direction, a layer-by-layer peeling method was employed.
In this study, the peeling resolution was controlled between 20 and 50 µm, with smaller intervals between surface peels to achieve higher accuracy.
After each peeling, the peeling depth was indirectly verified using a high-precision micrometer and the weighing method, combined with multiple repeat measurements to ensure depth accuracy was controlled within ±5 µm.
Machining creates sharp residual stress differences inside 7075 aluminum alloy. Stress gradients differ greatly between the surface and subsurface zones. The most dramatic variations appear within the 0–1 mm depth range.
Technicians set finer sampling intervals close to the outer surface. Each peeling layer reaches roughly 20 µm in thickness.
This fine division raises measurement resolution for this critical region. Mid and deep zones lie deeper than 1 mm. Wider layer spacing of nearly 50 µm applies to these positions.
Reasonable grading helps researchers gather abundant test data.
Results and Discussion
Surface Roughness Analysis
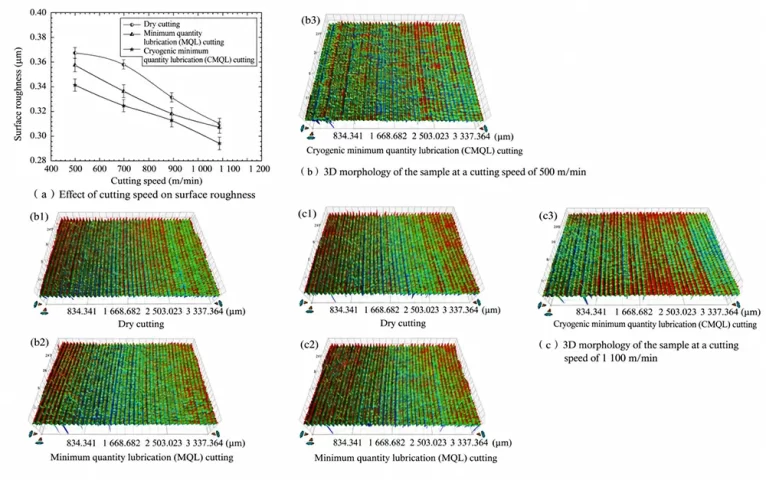
Figure 2 shows the surface roughness for different lubrication methods under various cutting speed conditions.
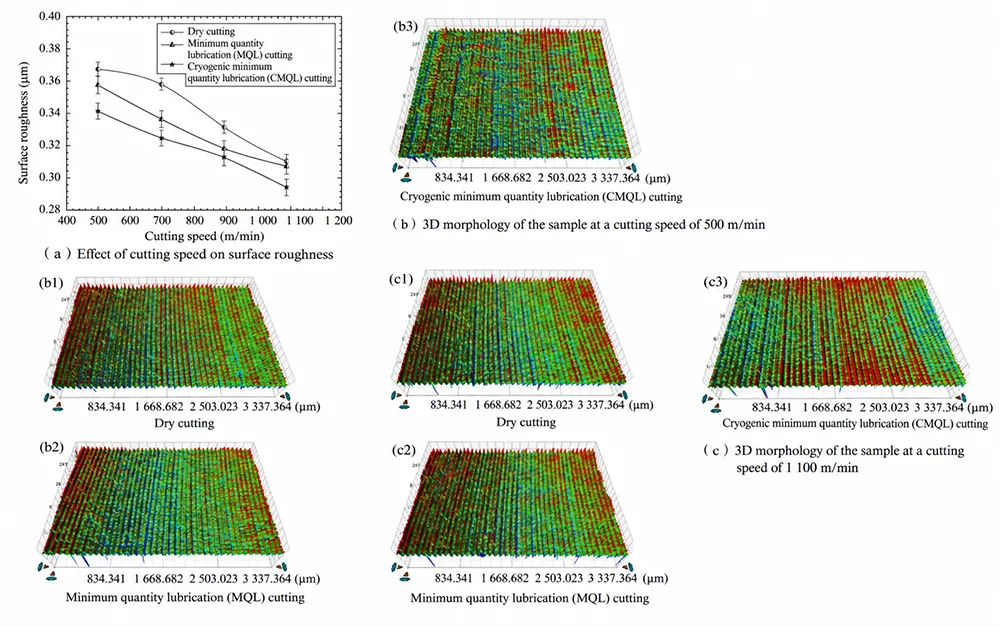
It can be seen that the machined surfaces produced by dry cutting, minimal-quantity lubrication (MQL) cutting, and low-temperature MQL cutting all exhibit distinct grooved patterns.
Surface roughness changes consistently across all three lubrication modes. Higher cutting speeds bring larger roughness values on finished workpieces.
Low-temperature MQL delivers the best surface outcome at 1100 m/min. Measured roughness drops to 0.293 μm under this condition. The value falls by 16.38 percent relative to the result at 500 m/min.
As shown in the figure, at all cutting speeds, the surface roughness follows the order: dry cutting > minimal lubrication cutting > low-temperature minimal lubrication cutting.
The maximum surface roughness values for dry cutting, minimal lubrication cutting, and low-temperature minimal lubrication cutting were 0. 367 µm, 0.356 µm, and 0.341 µm, respectively.
Minimal-quantity lubrication cuts surface roughness slightly against dry cutting. Its roughness value falls by 3.0 percent. Low-temperature minimal-quantity lubrication delivers better surface quality.
It reduces roughness by 7.62 percent relative to dry cutting. The value is also 4.40 percent lower than that under conventional MQL.
1. Effect of Cutting Speed on Surface Roughness
Analysis suggests that as cutting speed increases, friction in the tool-chip contact zone intensifies, releasing more cutting heat and causing the cutting temperature to rise.
This induces a thermal softening effect in the workpiece, which reduces cutting forces.
Furthermore, the built-up edge and burrs generated during the cutting process gradually diminish under the influence of the thermal softening effect, thereby reducing surface roughness.
Compared to dry cutting, minimally lubricated cutting introduces the lubricating effect of an oil film in the tool-chip contact area, which reduces the coefficient of friction and suppresses the formation of built-up edges and burrs;
Consequently, the surface roughness achieved by minimally lubricated cutting is superior to that of dry cutting.
Low-temperature media serve as a key additive for low-temperature MQL. They raise the viscosity of the lubricant film formed by MQL.
This modification lowers friction coefficients at the tool-chip interface. The frictional improvement outperforms that from conventional MQL.
Better lubrication directly benefits surface finish. Low-temperature MQL produces smoother surfaces. Its surface roughness outperforms dry cutting and regular MQL.
Figure 3 shows the surface roughness for different lubrication methods under various cutting depth conditions.
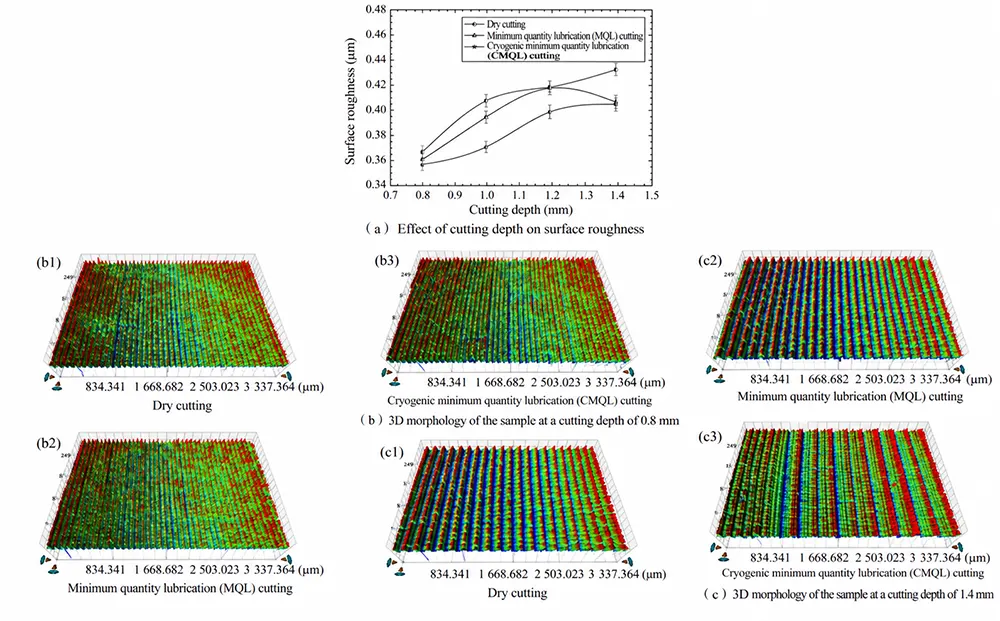
Surface roughness follows distinct trends under different lubrication setups. Dry cutting and low-temperature MQL share the same pattern. Roughness values climb alongside rising cutting depth.
Standard MQL produces a different response curve. Measured surface quality first degrades and then improves as cutting depth increases.
0.8 mm represents the optimal cutting depth for this alloy test. All three lubrication strategies record their minimum roughness at this setting.
Low-temperature MQL achieves the best result of 0.356 μm. This figure sits 3.09 percent lower than the dry-cut benchmark. It also drops 1.4 percent below the reading from conventional MQL treatment.
2. Effect of Cutting Depth on Surface Roughness
Analysis suggests that as the cutting depth increases, the amount of workpiece material removed per unit time increases significantly.
Cutting forces also increase accordingly, leading to intensified plastic deformation in the workpiece’s cutting layer.
At the same time, the increase in cutting depth causes a significant rise in cutting forces, which in turn intensifies machine tool vibration during the cutting process.
This intensified vibration further increases the surface roughness of the machined workpiece.
Therefore, under the combined influence of these multiple factors, the surface roughness of the machined surface increases significantly as the cutting depth increases.
Under minimal lubrication conditions, however, at shallower cutting depths, the lubricant can more easily penetrate the tool-chip interface and the cutting zone, effectively forming a lubricating oil film.
This reduces interfacial friction, slows down plastic deformation of the material surface, and results in lower surface roughness.
As the cutting depth increases, both the cutting forces and the contact area increase, leading to a more severe local temperature rise.
At this point, the lubricant struggles to penetrate sufficiently into the deeper cutting interface; The lubricating oil film loses its continuous structure. Friction rises at the contact interface.
Adhesion and scratching easily happen between tool and workpiece. These defects push up the final surface roughness. A larger cutting depth generates greater cutting force and heat. Temperatures climb inside the cutting zone. Local air flow turbulence also intensifies.
The lubricant mist redistributes more fully under such conditions. Heat and pressure help lubricant attach firmly to the cutting area. Lubrication performance improves accordingly. Cutting conditions become more stable.
In addition, increasing the cutting depth alters the chip evacuation path and plastic flow behavior, making the cutting process more continuous and stable.
This further improves material removal uniformity and surface quality, resulting in reduced surface roughness. Figure 4 shows the surface roughness under different feed rates for various lubrication methods.
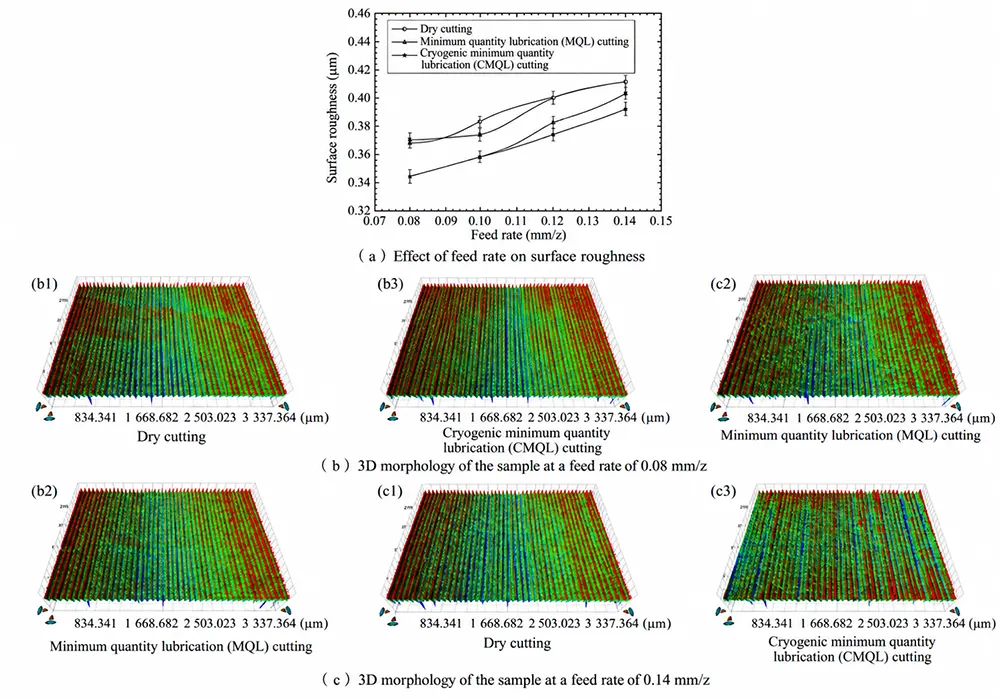
It can be seen that, as the feed rate changes, the surface roughness of the machined surface under the three lubrication methods tends to increase with an increase in feed rate.
When the feed rate is 0.08 mm/z, the surface roughness of the test specimens is the lowest;
Specifically, the surface roughness of the machined surfaces for dry cutting, minimal-quantity lubrication cutting, and low-temperature minimal-quantity lubrication cutting is 0.377, 0.373, and 0.346 µm, respectively.
3. Effect of Feed Rate on Surface Roughness
Analysis suggests that at lower feed rates, as the feed rate increases, the radial cutting depth also increases.
Under these conditions, friction in the cutting zone increases, leading to greater heat generation and higher cutting temperatures.
The workpiece undergoes thermal softening under such conditions. This effect restrains the generation of built-up edges and burrs. Surface roughness of the machined part decreases as a result.
A further rise in feed rate changes the material removal state. More material gets cut away within each unit of time.
Workpiece plastic deformation becomes more intense. Severe plastic deformation eventually raises surface roughness.
Surface Morphology Analysis
Figure 5 shows the SEM morphologies of machined surfaces under dry cutting, minimal lubrication cutting, and low-temperature minimal lubrication cutting conditions at different cutting speeds.
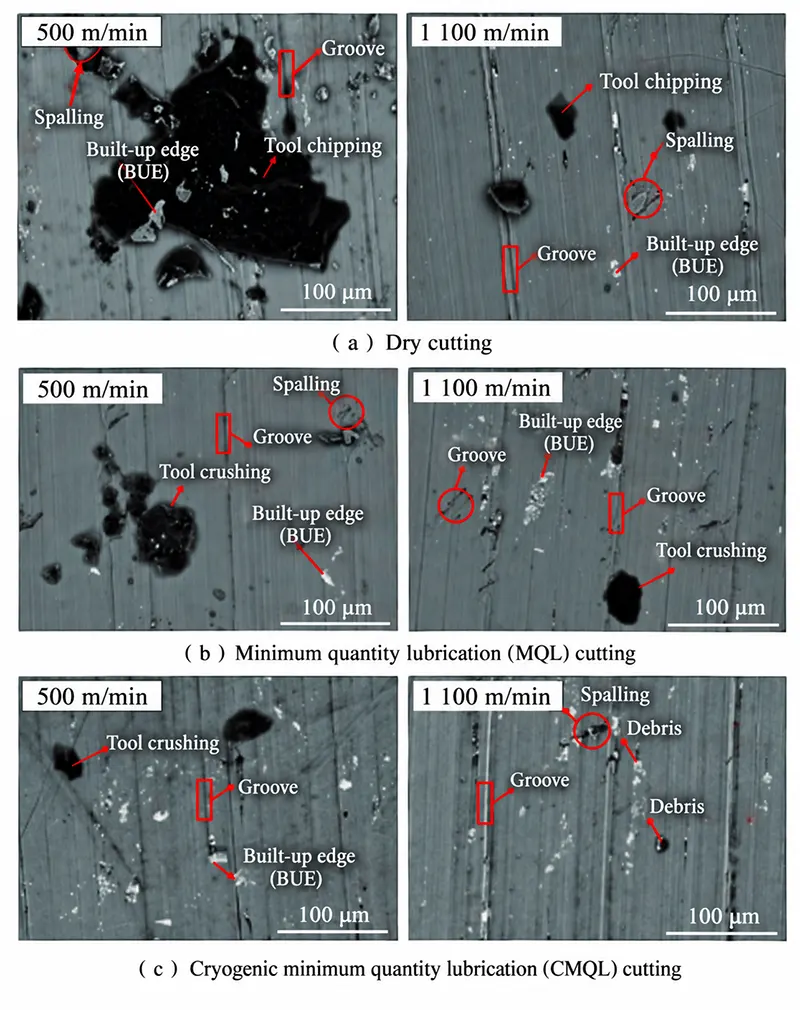
It can be observed that the machined surfaces resulting from dry cutting, minimal-lubrication cutting, and low-temperature minimal-lubrication cutting all exhibit distinct cutting marks, with chips and built-up edge fragments adhering to them.
In the case of dry cutting, as the cutting speed increases, the number of chips and built-up edge fragments adhering to the workpiece surface first increases and then decreases.
At a cutting speed of 500 m/min, large chunks of built-up edge fragments were observed adhering to the workpiece surface.
Analysis suggests that the thermal softening effect during the cutting process causes adhesion on the machined surface, and the cutting scratches and spalling are more pronounced compared to other cutting speeds.
This indicates that the plowing effect is more pronounced at this cutting speed, resulting in higher surface roughness.
For minimally lubricated cutting, as the cutting speed increases, the number of chips and built-up edge fragments adhering to the workpiece surface also tends to decrease.
At a cutting speed of 500 m/min, the number of chips and scratches on the workpiece’s machined surface was significantly higher than at a cutting speed of 1,100 m/min.
At this cutting speed, the plowing effect was more pronounced, resulting in higher surface roughness at 500 m/min.
Under low-temperature, minimal-lubrication cutting conditions, the number of built-up edge fragments tends to decrease as the cutting speed increases.
Workpieces machined at 1100 m/min show fewer chips and scratches. These surface defects compare against samples cut at 500 m/min.
Weaker plowing effects occur at this higher speed. Such material behavior reduces surface roughness at 1100 m/min. SEM images record surface features from three lubrication modes.
Dry cutting, MQL, and low-temperature MQL form the comparison group. Low-temperature MQL delivers the best overall surface quality. Every tested speed confirms its advantages. Fewer chips appear on specimens treated with low-temperature MQL.
Scratches also decrease in count and depth. Built-up edge debris and peeling regions shrink in size and quantity.
Dry cutting and regular MQL produce more severe surface damage. These differences make low-temperature MQL the better choice for surface finish.
1. Surface Morphology Evolution under Varying Cutting Speeds
Figure 6 shows SEM images of the machined surfaces for dry cutting, minimal-lubrication cutting, and low-temperature minimal-lubrication cutting under different cutting depth conditions.
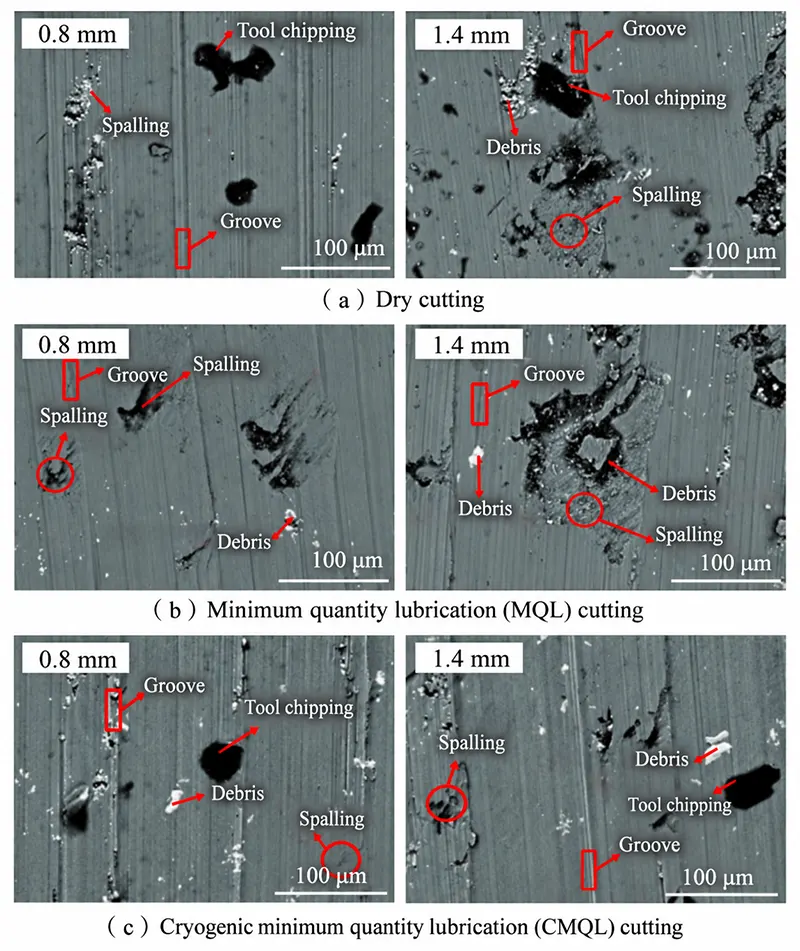
As the cutting depth increases, the surface quality of the workpiece under all three lubrication methods shows a downward trend.
For dry cutting, as the cutting depth increases, the number of chips and built-up edge fragments adhering to the workpiece surface gradually increases.
Pitting defects emerge widely on machined surfaces at the 1.4 mm cutting depth.
Cutting scratches grow deeper, and more chips attach to the workpiece. These features stand out against samples tested at other cutting depths. Chip and pit defects also evolve under MQL and low-temperature MQL.
Larger cutting depths bring more adherent chips on the surface. Pitting regions expand both in quantity and size.
At a cutting depth of 1.4 mm, large pitting areas appeared on the workpiece’s machined surface, and the number and size of chips also increased significantly.
Analysis suggests that an increase in cutting depth leads to a larger contact area between the tool and the workpiece, which in turn causes a significant increase in cutting forces.
Higher cutting forces induce intense plastic deformation on workpiece surfaces. Cutting scratches extend deeper into the material. Surface tearing and non-uniform deformation also occur.
All these changes impair the final surface quality. A larger cutting depth increases the volume of chips produced each second.
Chip removal becomes harder under this condition. Some chips stick to the workpiece surface. These adhered fragments develop into built-up edge residues.
The tool squeezes these leftover chips a second time. Scratches form again on the machined surface. Pitting defects may also appear. Surface quality deteriorates accordingly.
2. Surface Morphology Evolution under Varying Cutting Depths
Figure 7 presents SEM images of machined surfaces. Samples cover dry cutting, MQL and low-temperature MQL at different feed rates.
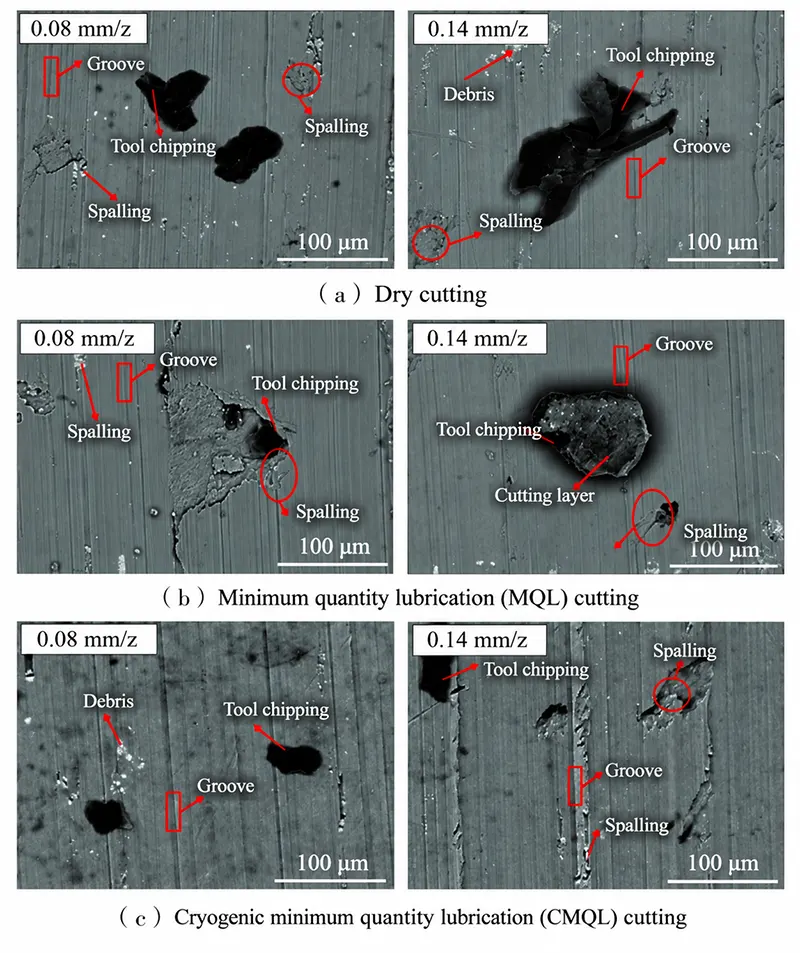
Feed rate adjustments reshape surface conditions under all three lubrication modes. Tested workflows include dry cutting, conventional MQL, and low-temperature MQL. Larger feed rates worsen cutting scratches on alloy surfaces.
Chip adhesion grows more serious alongside these scratches. Pitting defects also emerge on machined specimens. Extra debris and built-up edge fragments stick to workpiece surfaces gradually.
Analysis suggests that as the feed rate increases, the volume of material cut per tool revolution increases, leading to a significant rise in cutting forces.
These higher cutting forces subject the workpiece surface to greater cutting deformation, which in turn deepens the cutting scratches and increases surface roughness.
Furthermore, a higher feed rate alters the flow behavior of the material, expanding the shear deformation zone and increasing the generation of cutting heat, which intensifies work hardening and consequently affects surface quality.
At the same time, a higher feed rate accelerates tool wear, particularly on the tool’s rake face and cutting edge.
As the tool wears, its cutting edge becomes dull, increasing friction during the cutting process.
This results in uneven force distribution on the machined surface, thereby exacerbating the formation of surface scratches, chip adhesion, and pitting.
Residual Stress Analysis
The mechanism behind the formation of residual stress reflects the effects of different cutting methods.
During the cutting process, the surface layer of the workpiece undergoes severe plastic deformation and thermal shock, leading to the generation of residual stress.
Figure 8 shows the residual stress distribution for dry cutting, minimally lubricated cutting, and low-temperature minimally lubricated cutting under different cutting speed conditions.
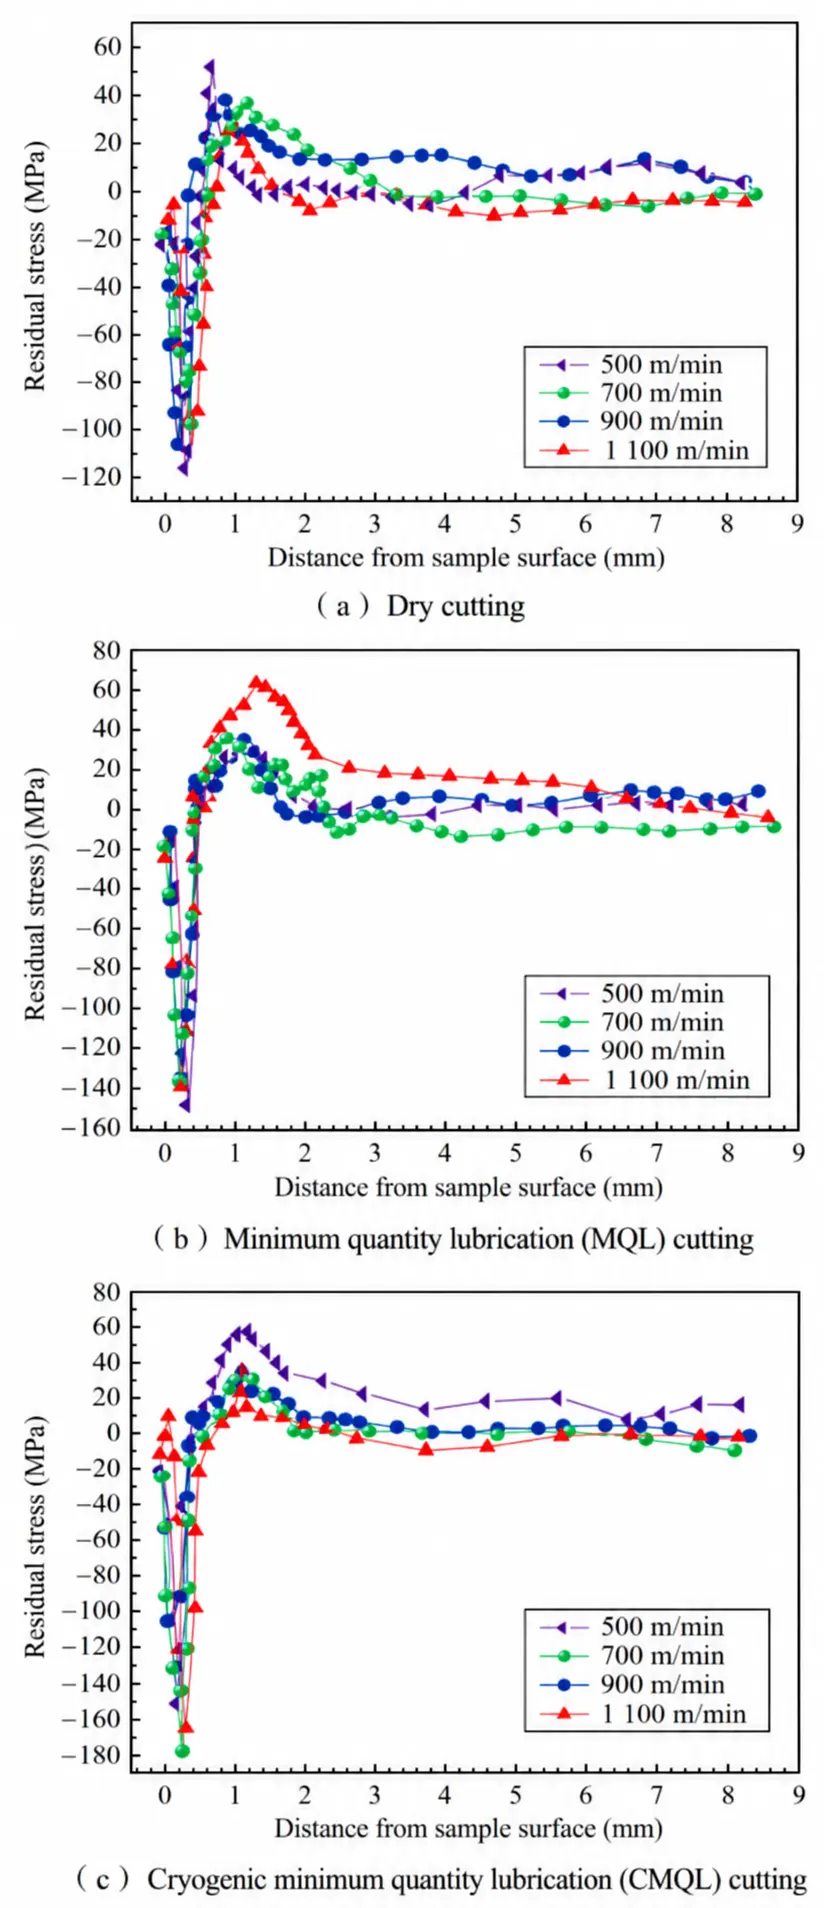
It can be seen that the primary range of residual stress extends from 0 to 2,000 µm below the workpiece surface. Residual stress curves share a special shape across all three lubrication strategies.
Profiles form an irregular spoon-like distribution. Residual compressive stress dominates all measured subsurface layers. The peak compressive stress changes consistently with rising cutting speed.
Dry cutting, MQL and low-temperature MQL follow the same pattern. The maximum value rises first, drops afterward, and levels off eventually.
Low-temperature MQL reaches its peak residual compressive stress at 500 m/min. The measured value is 178.59 MPa.
The diagram clarifies the ranking of peak stress under every tested speed. Low-temperature MQL produces the largest residual compressive stress. Conventional MQL comes second, and dry cutting yields the lowest value.
Compared with dry cutting, low-temperature MQL raises the peak stress by 58.05%. It also exceeds the value of standard MQL by 16.67%.
Rising cutting speeds amplify friction along the tool-chip contact area. Tool rake faces squeeze and rub the outermost workpiece material.
Extra mechanical action builds compressive stress against plastic deformation. Further acceleration boosts friction in this contact zone. More accumulated heat elevates local temperatures around the cutting edge.
Thermal stress deformation takes control of the material state. Stress coupling between heat and mechanical loads weakens compressive stress slightly.
Compared to dry cutting, the oil film introduced in the tool-chip contact zone during minimal-quantity lubrication (MQL) cutting serves to reduce friction, thereby decreasing the generation of cutting heat and lowering the cutting temperature.
This weakens the thermal stress coupling effect, resulting in residual compressive stresses that are greater in MQL cutting than in dry cutting.
In low-temperature minimal-lubrication cutting, the introduction of a low-temperature medium on top of minimal lubrication significantly enhances the heat exchange capacity of the cutting zone.
Most of the cutting heat is carried away by the low-temperature medium, resulting in a substantial reduction in cutting temperature.
The lubricant film from MQL lowers interfacial friction. This change weakens thermal stress coupling.
The effect is far less pronounced than that in dry cutting and regular MQL. For this reason, low-temperature MQL generates higher peak residual compressive stress.
Its value surpasses the results from conventional MQL and dry cutting. Figure 9 plots residual stress distribution curves.
It compares dry cutting, MQL and low-temperature MQL under varied cutting depths.
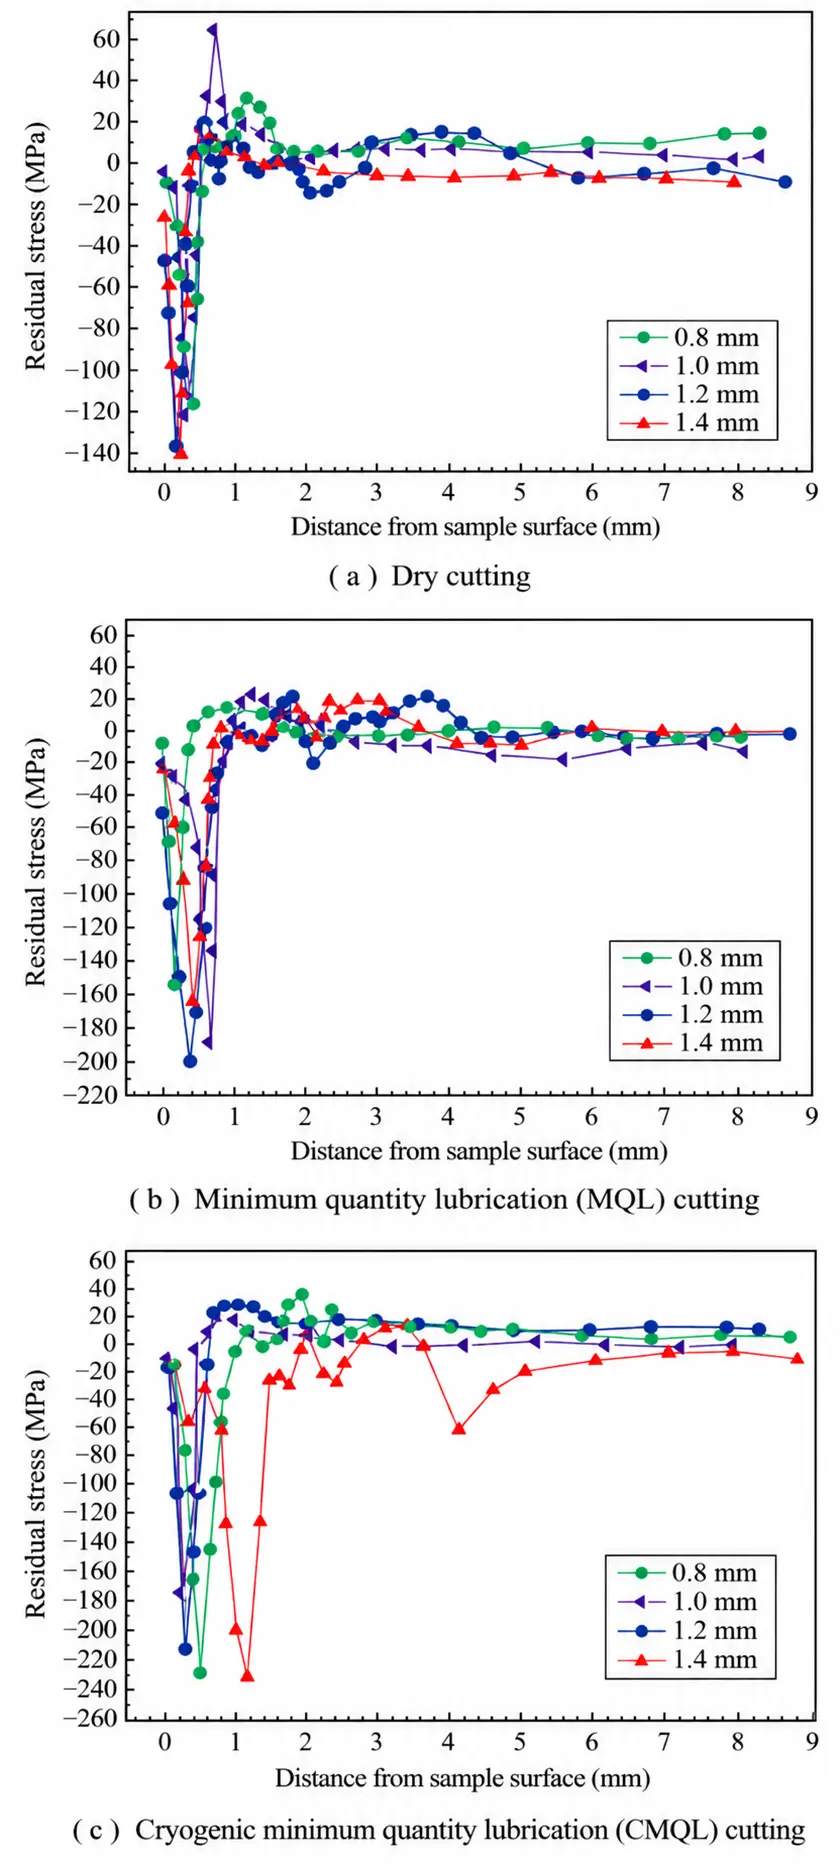
Residual compressive stress follows a similar trend across all three lubrication modes. Dry cutting, conventional MQL and low-temperature MQL respond to deeper cutting depths. Peak values rise first and decline afterward.
Low-temperature MQL hits its maximum stress at 1.4 mm cutting depth. The measured residual compressive stress reaches 233.32 MPa. This reading climbs 25.11 percent above the value recorded at 0.8 mm.
Analysis suggests that as the cutting depth increases, plastic deformation of the workpiece intensifies, leading to a rise in residual compressive stress.
As the cutting depth increases further, friction in the tool-chip contact zone intensifies during the cutting process, generating more cutting heat and raising the temperature in the cutting zone.
Under these conditions, thermal stress deformation gradually becomes dominant;
Due to the coupling effect of thermal stresses, compressive stress gradually transforms into tensile stress, resulting in a decrease in the maximum residual compressive stress.
Figure 10 shows the residual stress distribution for dry cutting, minimal-lubrication cutting, and low-temperature minimal-lubrication cutting under different feed rate conditions.
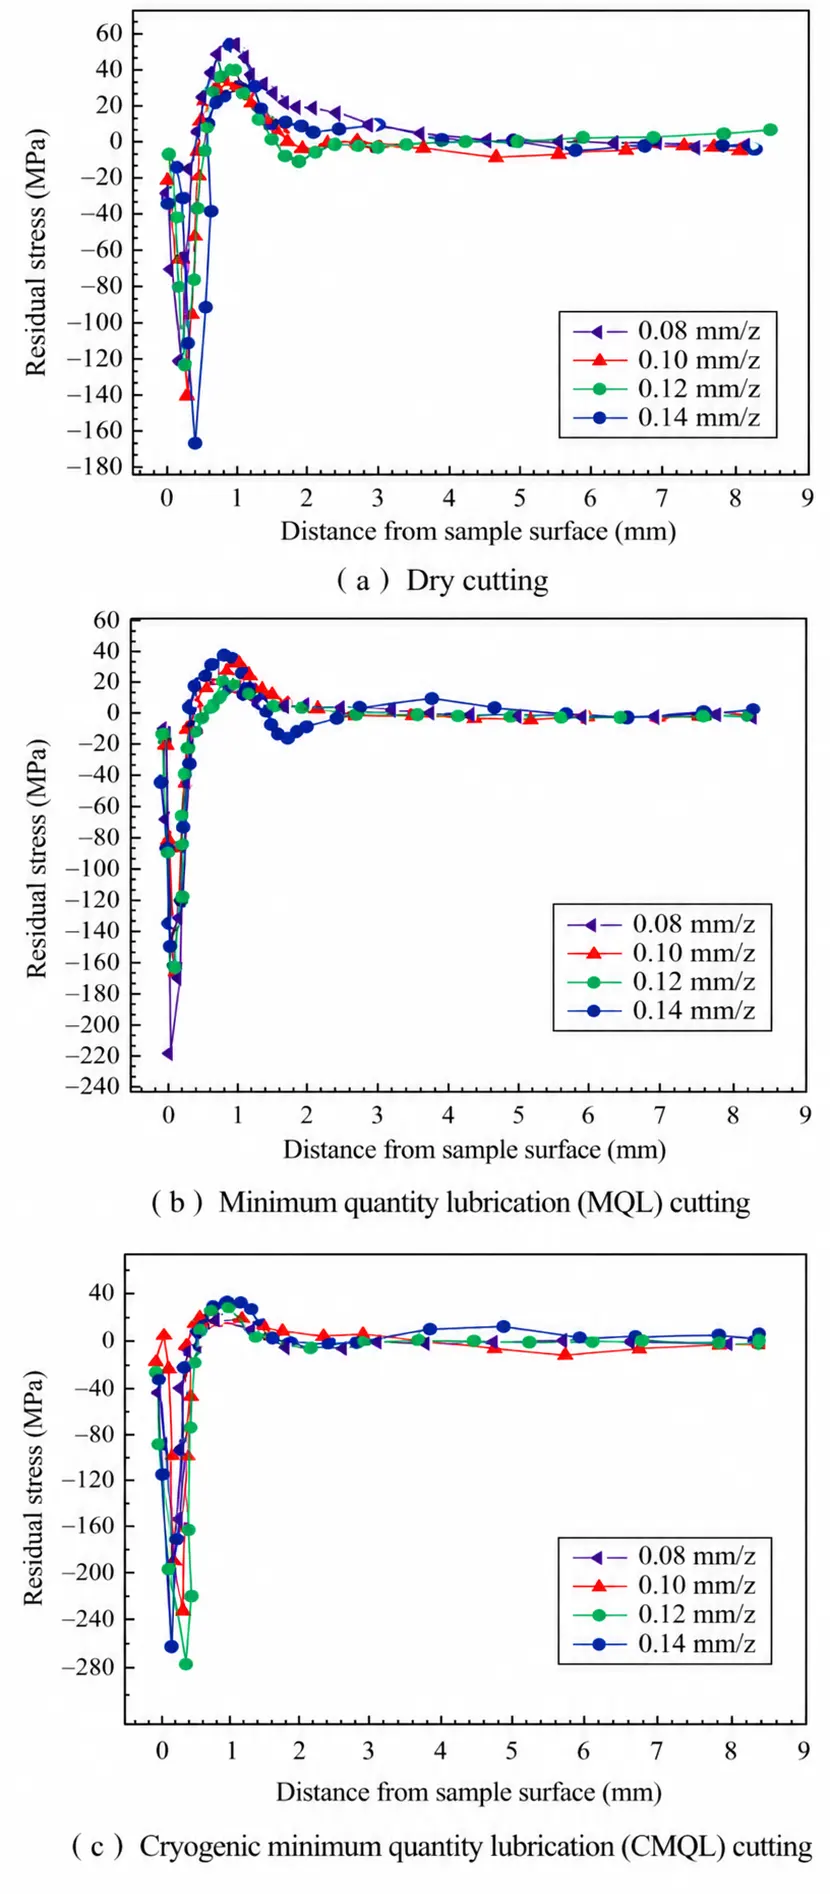
Residual compressive stress follows the same trend under all three lubrication setups. Measured values on machined 7075 aluminum alloy samples rise first and then fall.
Peak residual compressive stress grows with larger feed rates. This rule applies to dry cutting, conventional MQL and low-temperature MQL.
Low-temperature MQL reaches its maximum stress at 0.12 mm/z feed rate. The recorded residual compressive stress hits 260.24 MPa. This value is 186.58 percent higher than the result at 0.08 mm/z.
Larger feed rates boost cutting forces. Stronger mechanical loads trigger more severe plastic deformation on the surface layer. Such material deformation raises residual compressive stress.
Cutting forces stay low at the small feed rate of 0.08 mm/z. Plastic deformation remains limited. The sample therefore holds relatively low residual compressive stress. Raising the feed rate to 0.12 mm/z further increases cutting force.
Surface material develops more intense plastic flow. Residual compressive stress increases accordingly. Secondly, low-temperature minimal-quantity lubrication has a significant impact on cutting temperature;
This method keeps cutting temperatures under effective control. It shrinks the depth of the heat-affected zone. Thermal stress development gets restrained. Workpiece surfaces retain high residual compressive stress.
A larger feed rate raises the material removal volume each second. The thickness of the cutting layer also increases. The workpiece surface bears stronger compressive loading.
Small feed rates remove less material. Thin cutting layers impose mild influence on surface plastic deformation. Measured residual compressive stress stays relatively low.
Higher feed rates accelerate material removal. Thicker cutting layers form accordingly. Surface material sustains greater compressive force. Residual compressive stress climbs to its peak value.
Conclusions
This research takes 7075 aluminum alloy as its research object. Three lubrication schemes set up the comparison group.
Test backgrounds include dry cutting, minimal-quantity lubrication and low-temperature minimal-quantity lubrication.
Engineers explore how these schemes and cutting parameters affect surface integrity. All observations target high-speed machining of 7075-T6 alloy.
The following conclusions were drawn.
(1) Low-Temperature Minimal Lubrication Improves 7075 Aluminum Surface Roughness
Among the three lubrication methods—dry cutting, minimal lubrication cutting, and low-temperature minimal lubrication cutting—the three-dimensional topography of the workpiece’s cut surface exhibited a distinct grooved pattern in all cases.
Under different cutting parameters, the surface roughness followed the order: dry cutting > minimal lubrication > low-temperature minimal lubrication.
At different cutting speeds, the maximum surface roughness values for low-temperature minimal-lubrication cutting were 7.62% lower than those for dry cutting and 4.4% lower than those for minimal-lubrication cutting.
Therefore, when performing high-speed cutting of 7075 aluminum alloy, low-temperature minimal-lubrication cutting yields better surface roughness compared to dry cutting and minimal-lubrication cutting.
(2) Low-Temperature Minimal Lubrication Improves 7075 Aluminum Surface Topography
Among the three lubrication methods—dry cutting, minimal lubrication cutting, and low-temperature minimal lubrication cutting—low-temperature minimal lubrication cutting consistently produced the best surface topography under various cutting parameters.
Under various cutting parameters, the number of chips, the depth and number of cutting scratches, and the size and number of built-up edge fragments and flaking sections were significantly lower in low-temperature minimal-lubrication cutting than in dry cutting and minimal-lubrication cutting.
Therefore, when high-speed cutting 7075 aluminum alloy, low-temperature minimal-lubrication cutting yields the best surface topography compared to dry cutting and minimal-lubrication cutting.
(3) Low-Temperature Minimal Lubrication Enhances Residual Compressive Stress in 7075 Aluminum
Among the three different lubrication methods—dry cutting, minimal lubrication cutting, and low-temperature minimal lubrication cutting—under various cutting speed, cutting depth, and feed rate parameters, the primary range of residual stresses after cutting for all three methods is 0 to 2,000 µm below the workpiece surface.
The trends in residual stress distribution all exhibit an irregular “spoon-shaped” pattern, and the residual stresses are primarily compressive.
In most cases, the maximum residual compressive stress follows the order: low-temperature minimal-lubrication cutting > minimal-lubrication cutting > dry cutting.
Specifically, at different cutting speeds, the maximum residual compressive stress in low-temperature minimal-quantity lubrication cutting was 58.05% higher than that in dry cutting and 16.67% higher than that in minimal-quantity lubrication cutting.