

High-end equipment sectors such as aerospace, petrochemicals, and defense and military industries are evolving toward lighter weight, higher efficiency, and greater precision, placing higher demands on component structures and machining accuracy, and driving the expanding application of ring groove machining on the inner walls of deep holes.
However, due to the confined space within deep holes and limitations imposed by the length-to-diameter ratio, this machining process still faces several technical challenges.
Traditional cutting tools have limited radial feed space, making it difficult to machine complex groove profiles; the long, narrow bore cavity can easily cause poor chip evacuation, leading to chip buildup, surface scratches, and tool breakage.
Furthermore, cutting heat cannot be effectively dissipated, which can easily cause tool wear and workpiece thermal deformation, thereby reducing machining accuracy and surface integrity.
To address these issues, this paper designs a specialized machining system for ring grooves on the inner walls of deep holes and conducts research on the optimization of cutting parameters.
Current Status of Research on Deep-Hole Machining Tools and Cutting Parameters
Tool geometry and cutting parameters directly influence chip evacuation, machining stability, and surface quality in deep-hole machining. Researchers have conducted extensive studies on complex internal cavity structures, such as ring grooves and non-circular cross-sections.
Some researchers have developed chamber boring systems that convert the rotational motion of the spindle into radial tool motion via a cam disc and guide rail mechanism, thereby enabling the precision machining of complex internal cavity contours.
In terms of cutting parameter optimization, other experts have employed response surface methods and genetic algorithms to optimize deep-hole boring parameters for Ti-6Al-4V, effectively reducing cutting forces and controlling hole wall roughness to Ra 3.2 μm.
In addition, researchers have investigated the mechanisms of tool wear during deep-hole drilling of 304 stainless steel. The results indicate that chip removal friction and heat accumulation exacerbate tool wear, leading to a significant increase in drilling force, surface roughness, and hole straightness errors.
The above studies demonstrate that rational tool geometry design and optimization of cutting parameters are key to improving deep-hole machining quality, controlling tool wear, and enhancing chip removal efficiency.
Multi-Objective Optimization Study Using BBD and NSGA-II
The response surface method can establish predictive models between cutting parameters and machining indicators. Among these, BBD (Box-Behnken Design) can analyze parameter interactions with a relatively small number of experiments; however, when used alone for multi-objective optimization, it is prone to getting stuck in local optima. The NSGA-II algorithm possesses strong global multi-objective optimization capabilities and can compensate for this shortcoming.
Some researchers have combined BBD and NSGA-II to optimize deep-hole gun drill parameters for H13 die steel, effectively reducing drilling force and cutting temperature.
Relevant studies indicate that the combination of BBD and NSGA-II is well-suited for metal-cutting process optimization. Therefore, this paper adopts this method to optimize the machining parameters for ring grooves on the inner walls of deep holes.
Research Scope and Technical Approach
This study focuses on P550 non-magnetic stainless steel tubing. A dedicated deep-hole inner-wall annular groove machining system was designed, and a finite element simulation model was established using Deform-3D.
The BBD response surface method was employed, with spindle speed, back-cut depth, and feed rate as experimental variables, and tool wear depth and chip length as optimization objectives, to establish corresponding predictive models.
Furthermore, the NSGA-II algorithm was introduced to perform global multi-objective optimization, yielding a set of parameters that balance low tool wear, effective chip breaking, and high machining efficiency. Finally, machining experiments were conducted to verify the feasibility and effectiveness of the optimized results.
Design of the Deep-Hole Internal Annular Groove Machining System
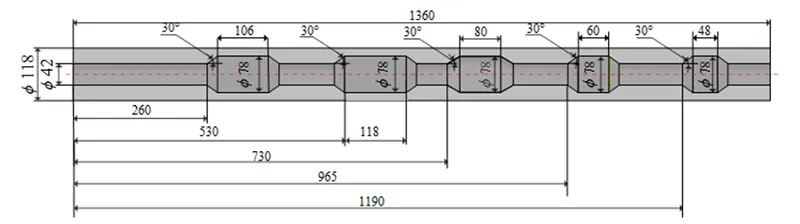
The workpiece consists of a P550 non-magnetic stainless steel tube measuring 1360 mm long with a 42 mm inner diameter. Figure 1 illustrates the required internal trapezoidal annular groove structure.
Five trapezoidal grooves of different widths must be machined along the inner wall. Each groove has a bottom diameter of 78 mm and a radial depth of 18 mm.
The required diameter variation ratio reaches 1.86, creating considerable challenges for machining access, tool stability, and chip evacuation.
Major Machining Challenges
> Difficult Chip Breaking and Evacuation
P550 non-magnetic stainless steel tends to generate long ribbon-shaped chips during machining. The narrow internal cavity and high length-to-diameter ratio encourage chip accumulation inside annular grooves.
Accumulated chips can scratch machined surfaces, obstruct evacuation channels, and cause cutting-edge chipping.
> Insufficient Tool Vibration Resistance
The workpiece has a length-to-diameter ratio exceeding 32, with machining positions distributed across a considerable axial distance. Restricted internal space requires substantial axial and radial tool overhangs.
These conditions increase vibration during deep groove cutting, reducing groove profile accuracy and surface quality.
> Difficult Coordination Between Tool Design and Cutting Parameters
The variable-diameter tool must balance structural strength, wear resistance, chip evacuation, and heat dissipation. It must also support continuous machining and retraction across five separate groove sections.
Long-distance, multi-cavity machining complicates tool geometry, chip channel design, cutting paths, and process parameter selection.
Structure and Operating Principle of the Machining System
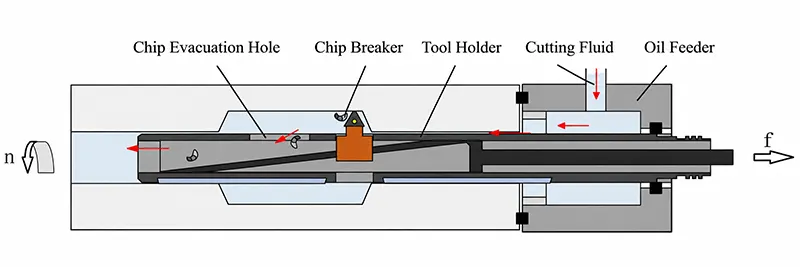
A specialized deep-hole internal annular groove machining system was developed to meet the trapezoidal groove requirements. Figure 2 illustrates its operating principle.
The system uses pull boring, combining workpiece rotation, axial tool feeding, and radial tool expansion. These coordinated movements enable precise machining of internal annular grooves.
A wedge-slider mechanism controls radial tool expansion and achieves a maximum diameter variation ratio of 1.9. This design provides the large radial adjustment required for deep-hole groove machining.
Dedicated chip evacuation holes in the tool housing address the difficult chip removal conditions associated with P550 stainless steel. High-pressure cutting fluid enters through an oil supply device and flows toward the cutting zone.
The fluid travels through the clearance between the boring bar and workpiece inner wall. It carries chips through evacuation holes and discharges them along the hollow boring bar.
Guide Support and Vibration Suppression
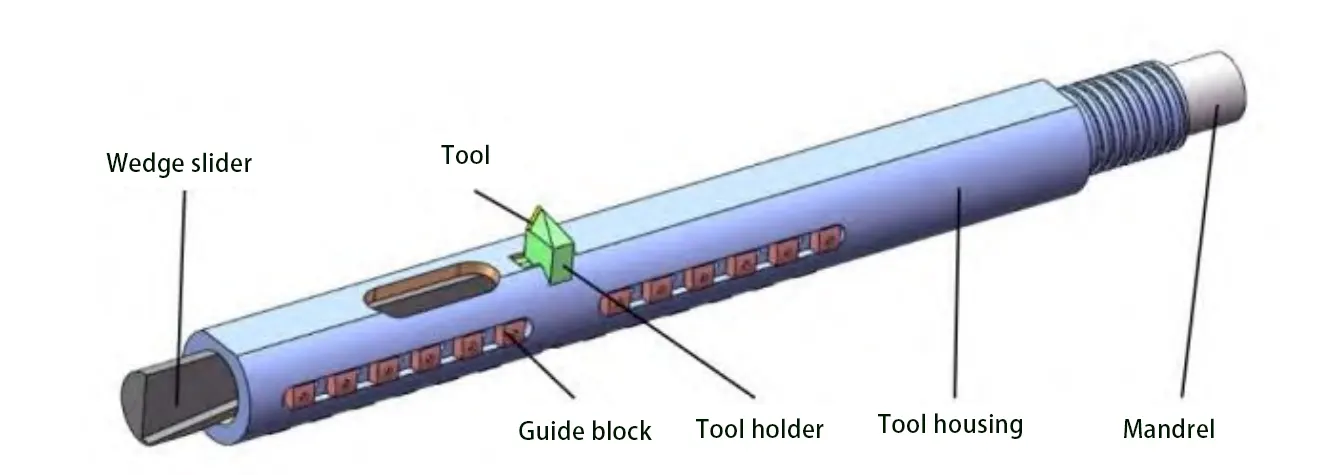
Multiple guide support blocks improve tool stability and prevent axis deviation caused by long overhangs. Figure 3 illustrates the variable-diameter boring tool structure.
The guide blocks follow circumferential arrangements and two axial rows, converting cantilever loading into a simply supported configuration. Cutting forces near the tool tip transfer mainly through these supports.
According to beam bending theory, this configuration reduces maximum bending moment and deflection compared with an equivalent cantilever. Consequently, it suppresses tool bending and axis deviation while providing self-guidance.
The guide blocks maintain a close clearance fit with the machined hole wall. Technicians grind their dimensions according to the measured hole diameter.
Diametral clearance ranges from 0.01 to 0.02 mm, corresponding to unilateral clearance between 0.005 and 0.01 mm. The opposing guide-block dimension remains 0.01–0.02 mm smaller than the measured hole diameter.
Finite Element Modeling and Multi-Objective Parameter Optimization
Finite Element Model Development
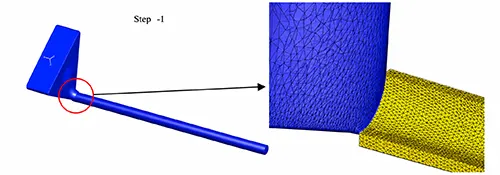
Deep-hole internal groove machining uses a single cutting edge with localized workpiece contact. Its material deformation and removal mechanisms closely resemble conventional turning.
Therefore, the study simplifies annular groove machining into a turning model using the Deform-3D turning module. Figure 4 illustrates the simplified finite element model.
The simulation examines a 44 mm section of the workpiece’s internal machining profile. P550 non-magnetic stainless steel serves as the workpiece material.
Table 1 lists the mechanical and physical properties of P550 stainless steel and YG8 cemented carbide.
| Material | Density (g/cm³) | Elastic Modulus (MPa) | Poisson’s Ratio | Thermal Conductivity (W/m·K) | Linear Expansion Coefficient (10⁻⁶/K) | Specific Heat (J/kg·K) |
|---|---|---|---|---|---|---|
| P550 | 7.85 | 206000 | 0.29 | 55.0 | 11.8 | 460 |
| YG8 | 14.6 | 600000 | 0.22 | 75.4 | 4.5 | 220 |
Table 1. Mechanical and Physical Properties of P550 and YG8
The simulation uses the Johnson-Cook constitutive model to describe material plasticity. Table 2 presents the constitutive parameters for P550 stainless steel.
| A (MPa) | B (MPa) | C | n | m | Tm (°C) | Tr (°C) |
|---|---|---|---|---|---|---|
| 920 | 680 | 0.035 | 0.32 | 0.75 | 1450 | 20 |
Table 2. Johnson-Cook Constitutive Model Parameters for P550
Finite Element Meshing and Boundary Conditions
Tetrahedral elements divide the workpiece and cutting tool into finite element meshes. The initial workpiece mesh contains approximately 125,000 elements.
Element sizes measure 0.1 mm in the cutting zone and 0.2 mm elsewhere, balancing computational accuracy and efficiency. Adaptive remeshing maintains numerical stability during severe deformation.
The equivalent plastic strain threshold is 0.3, while the mesh distortion threshold is 0.7. Exceeding either threshold automatically triggers local remeshing to prevent excessive distortion and numerical divergence.
The cutting tool uses YG8 cemented carbide, with approximately 92,000 initial mesh elements and a maximum size ratio of four. Tool geometry includes a 1° rake angle and a 2° clearance angle.
The cutting-edge radius is 0.0 mm, matching the actual tool geometry.
The workpiece receives fully fixed constraints on the XY and ZY planes to prevent rigid-body displacement. Tool movement retains cutting feed along the Y-axis and rotation around its own axis.
Simulation conditions determine the corresponding cutting speed and feed rate. A Coulomb friction model describes tool-workpiece contact with a friction coefficient of 0.15.
Tool Wear Prediction Model
The Deform-3D Wear Calculation function evaluates tool wear using the built-in Usui wear model.
Hw = ∫ α · p · v · e−β/T dt
Here, Hw represents tool wear depth in millimeters, p represents contact pressure in MPa, and v represents sliding velocity in m/s. T denotes absolute interface temperature in kelvin.
The experimental coefficients are α = 1 × 10⁻⁵ and β = 1000, based on difficult-to-machine material cutting experience. The simulation integrates the Usui model and outputs wear data every ten computational steps.
Response Surface Experimental Design
The study combines BBD response surface methodology with genetic optimization to determine suitable cutting parameters. Three factors at three levels define the experimental design.
Spindle speed, depth of cut, and feed rate serve as independent variables. Tool wear depth and maximum chip length provide the response indicators.
Parameter ranges follow previous deep-hole machining studies and practical experience with P550 stainless steel. Spindle speed ranges from 100 to 300 r/min.
Depth of cut ranges from 0.5 to 1.5 mm, while feed rate ranges from 0.05 to 0.15 mm/r. Table 3 presents the experimental factor levels.
| Process Parameter | Level −1 | Level 0 | Level +1 |
|---|---|---|---|
| Spindle Speed n (r/min) | 100 | 200 | 300 |
| Depth of Cut ap (mm) | 0.5 | 1.0 | 1.5 |
| Feed Rate f (mm/r) | 0.05 | 0.10 | 0.15 |
Table 3. Levels of Process Parameters
Experimental Verification Scheme
Machining Platform and Experimental Setup
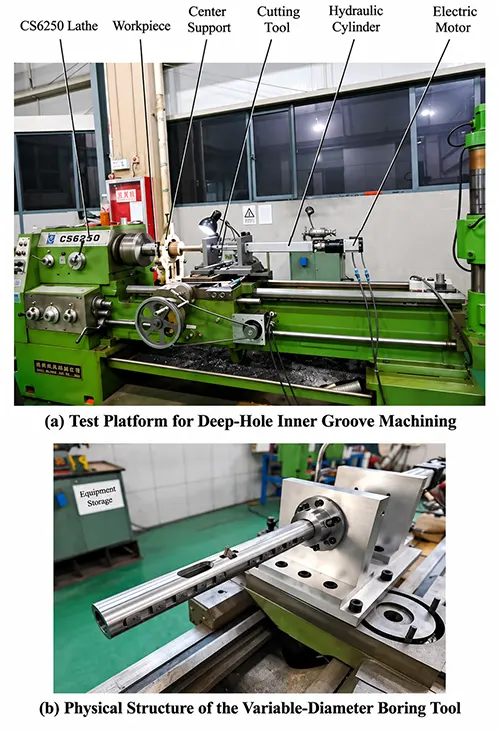
The experimental platform uses a modified CS6250 lathe, as shown in Figure 5a. Functional modifications integrate the machining system without substantially changing the original lathe structure.
The platform consists of the lathe base, specialized deep-hole annular groove tooling, and a control system. An electric cylinder generates axial linear movement through motor drive.
A central shaft and wedge-slider mechanism convert this movement into radial tool expansion and retraction. Figure 5b shows the physical variable-diameter boring tool.
The workpiece is a P550 non-magnetic stainless steel tube measuring 1360 mm long with a 42 mm inner diameter. Machining uses layered radial cutting, circumferential segmented chip breaking, and contour interpolation finishing.
Machining Quality Inspection
After machining the trapezoidal grooves, the researchers select one groove and section the specimen axially. They inspect the groove’s internal surface for dimensional accuracy and surface quality.
Microscopic examination evaluates chip morphology and verifies chip-breaking performance. A bridge-type coordinate measuring machine measures the groove’s three-dimensional geometry.
Axial cross-sectional point clouds reconstruct the groove profile and quantify dimensional deviations. Roundness and straightness errors provide additional indicators of machining accuracy.
Results and Analysis
Finite Element Model Accuracy Verification Based on Chip Length
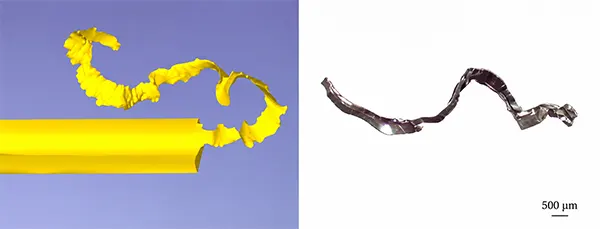
Experimental chip morphology provides a basis for validating the finite element model. The simulation uses 200 r/min spindle speed, 1 mm depth of cut, and 0.1 mm/r feed.
Physical machining experiments apply identical parameters to produce comparable chip samples. An SZM7045 stereomicroscope captures the actual chip morphology for comparison with simulation results.
Figure 6 compares the simulated and experimental chips. Both exhibit ribbon-like spiral structures, although their overall dimensions differ.
During actual machining, chips pass through a narrow annular gap between the hole wall and boring bar. High-pressure cutting fluid and chip compression cause additional plastic deformation.
The simplified finite element model cannot fully reproduce these secondary deformation mechanisms. Therefore, the researchers select stable curled chip sections for quantitative comparison.
Comparing flattened chip lengths gives a relative error of 13.04% between simulation and experimental measurements. This accuracy meets the requirements for machining behavior analysis and parameter optimization.
Response Surface Simulation Results
The BBD experimental design includes 17 simulation combinations for P550 non-magnetic stainless steel. Each simulation produces tool wear depth and maximum chip length data.
Table 4 presents the results for different spindle speeds, cutting depths, and feed rates.
| No. | n (r/min) | ap (mm) | f (mm/r) | Hw (mm) | Lc,max (mm) |
|---|---|---|---|---|---|
| 1 | 100 | 0.5 | 0.10 | 0.0075 | 5.23 |
| 2 | 200 | 1.0 | 0.10 | 0.0168 | 27.59 |
| 3 | 300 | 0.5 | 0.10 | 0.0083 | 4.78 |
| 4 | 200 | 1.0 | 0.10 | 0.0168 | 27.59 |
| 5 | 100 | 1.5 | 0.10 | 0.0176 | 22.47 |
| 6 | 200 | 1.0 | 0.10 | 0.0168 | 27.59 |
| 7 | 300 | 1.5 | 0.10 | 0.0185 | 26.83 |
| 8 | 200 | 1.0 | 0.10 | 0.0168 | 27.59 |
| 9 | 100 | 1.0 | 0.05 | 0.0149 | 20.36 |
| 10 | 300 | 1.0 | 0.05 | 0.0130 | 19.29 |
| 11 | 100 | 1.0 | 0.15 | 0.0180 | 21.78 |
| 12 | 300 | 1.0 | 0.15 | 0.0203 | 20.93 |
| 13 | 200 | 0.5 | 0.05 | 0.0060 | 4.12 |
| 14 | 200 | 1.5 | 0.05 | 0.0146 | 20.98 |
| 15 | 200 | 0.5 | 0.15 | 0.0125 | 8.37 |
| 16 | 200 | 1.5 | 0.15 | 0.0193 | 29.16 |
| 17 | 200 | 1.0 | 0.10 | 0.0168 | 27.59 |
Table 4. Experimental Results of the Box-Behnken Design
Response Surface Analysis of Variance
Regression analysis of the BBD results establishes predictive models for tool wear depth and maximum chip length. The resulting equations describe individual parameter effects and interactions.
Tool wear depth follows the regression equation below.
Hw = −0.0111 − 1.1 × 10⁻⁵n + 0.039725ap + 0.035f + 5.0 × 10⁻⁷n·ap + 2.1 × 10⁻⁴n·f − 0.018ap·f − 1.875 × 10⁻⁸n2 − 0.01455ap2 − 0.025f2
Maximum chip length follows the regression equation below.
Lc,max = −50.445 + 0.133938n + 81.275ap + 224.025f + 0.02405n·ap + 0.011n·f + 39.3ap·f − 3.92 × 10⁻⁴n2 − 35.39ap2 − 1234f2
The coefficients of determination reach 0.9884 for tool wear depth and 0.9877 for maximum chip length. These values indicate strong predictive performance within the investigated parameter ranges.
Analysis of variance evaluates model significance through F-values and P-values. A P-value below 0.05 indicates statistical significance.
Both regression models have P-values below 0.0001, confirming their statistical significance. Table 5 presents the analysis of variance results.
| Source | DF | Tool Wear Depth | Maximum Chip Length | ||
|---|---|---|---|---|---|
| F-value | P-value | F-value | P-value | ||
| Model | 9 | 66.15 | <0.0001 | 62.57 | <0.0001 |
| A – n | 1 | 1.17 | 0.3149 | 0.2227 | 0.6513 |
| B – ap | 1 | 338.70 | <0.0001 | 338.70 | <0.0001 |
| C – f | 1 | 123.99 | <0.0001 | 13.49 | 0.0079 |
| AB | 1 | 0.0053 | 0.9439 | 2.60 | 0.1508 |
| AC | 1 | 9.38 | 0.0183 | 0.0054 | 0.9432 |
| BC | 1 | 1.72 | 0.2308 | 1.74 | 0.2290 |
| A² | 1 | 0.3147 | 0.5923 | 29.03 | 0.0010 |
| B² | 1 | 118.44 | <0.0001 | 148.28 | <0.0001 |
| C² | 1 | 0.0350 | 0.8570 | 18.03 | 0.0038 |
| Residual | 7 | — | — | — | — |
| Lack of Fit | 3 | — | — | — | — |
Table 5. Analysis of Variance for the Response Surface Models
> Analysis of Variance for the Tool Wear Depth Prediction Model
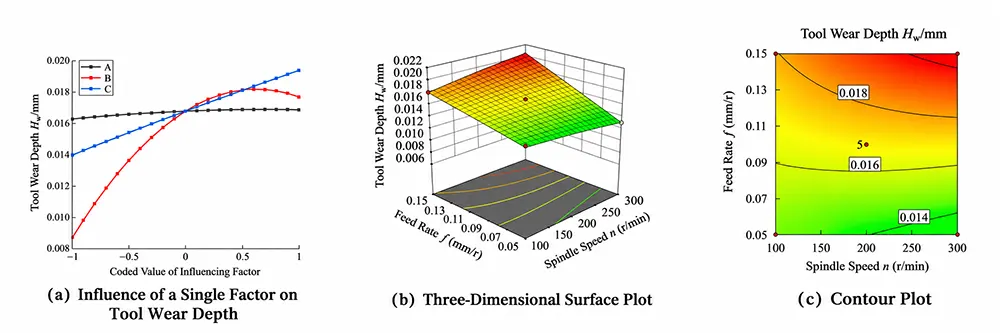
The three individual factors influence tool wear depth in descending order: depth of cut, feed rate, and spindle speed. Depth of cut produces the strongest effect, while spindle speed has the weakest influence.
Figure 7a illustrates these relationships. Tool wear depth generally increases with spindle speed and feed rate, with feed rate producing a stronger effect.
Depth of cut shows a nonlinear relationship with tool wear depth. Wear initially increases as cutting depth rises, then decreases slightly at higher depths.
Increasing cutting depth enlarges the contact area and cutting layer volume, raising cutting forces and tool loading. Higher feed increases undeformed chip thickness and cutting resistance, accelerating wear.
However, relatively low spindle speeds between 100 and 300 r/min limit thermal loading. High-pressure cutting fluid further suppresses temperature-related wear, reducing the individual influence of spindle speed.
Interaction analysis gives PAC = 0.0183, PBC = 0.2308, and PAB = 0.9439. Therefore, spindle speed and feed rate exhibit the strongest interaction affecting tool wear depth.
The interaction between cutting depth and feed ranks second, while spindle speed and cutting depth show the weakest interaction.
Figures 7b and 7c illustrate the spindle speed-feed interaction through a three-dimensional response surface and contour plot. Tool wear generally increases with both variables.
At low spindle speeds, increasing feed produces a relatively moderate increase in tool wear. At higher speeds, increasing feed significantly accelerates wear.
Similarly, increasing spindle speed under high-feed conditions intensifies tool deterioration. Higher cutting speeds increase friction and temperature, promoting thermal and adhesive wear.
High feed also increases chip thickness and cutting forces, creating stronger combined thermomechanical loading. These conditions accelerate cutting-edge damage.
Increasing depth of cut distributes cutting forces and heat across a longer cutting edge, reducing localized loading. Consequently, interactions involving cutting depth do not significantly intensify tool wear.
> Analysis of Variance for the Maximum Chip Length Prediction Model
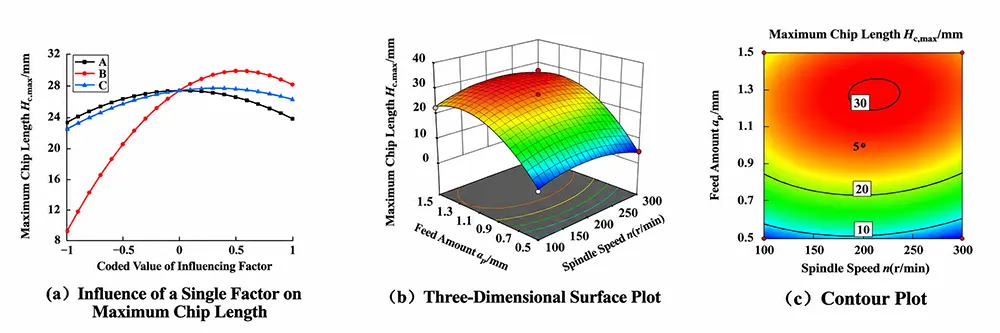
Depth of cut has the strongest influence on maximum chip length, followed by feed rate and spindle speed. Depth of cut shows high statistical significance, while spindle speed has no significant individual effect.
Figure 8a illustrates the individual factor relationships. Spindle speed, depth of cut, and feed rate exhibit nonlinear trends, initially increasing chip length before producing slight reductions.
Spindle speed and feed rate show relatively weak nonlinear behavior. Depth of cut produces the most pronounced variation in chip length.
Among the parameter interactions, spindle speed and depth of cut have the strongest relative influence on maximum chip length. Figures 8b and 8c illustrate this interaction through response surface and contour plots.
The response surface forms a pronounced upward convex profile with changing gradients. Closed elliptical contours indicate substantial coupling between spindle speed and cutting depth.
At low cutting depths, increasing spindle speed produces relatively small changes in chip length. Maximum chip length remains within a comparatively low range.
At moderate and high cutting depths, chip length initially increases significantly with spindle speed before declining slightly. This behavior reflects changes in chip rigidity and cutting-zone temperature.
Increasing cutting depth enlarges the cutting layer cross-section, increasing chip thickness and stiffness. Stronger chips resist bending and fracture while passing through the chip-breaking groove.
Higher spindle speeds increase cutting temperatures and enhance local material plasticity, encouraging continuous ribbon-shaped chips. At extremely high speeds, thermal softening and chip collisions may promote secondary chip fracture.
Consequently, maximum chip length can decrease slightly in the highest spindle speed region.
Process Parameter Optimization Based on Genetic Algorithms
Deep-hole internal annular groove machining involves coupled interactions between cutting parameters, tool wear depth, and maximum chip length. Therefore, parameter selection represents a nonlinear, constrained multi-objective optimization problem.
Response surface methodology establishes quantitative prediction models linking cutting parameters with machining performance. However, conventional BBD optimization may converge toward local optima when multiple competing objectives exist.
Deep-hole groove machining must balance tool durability, chip evacuation, and machining efficiency. Therefore, the optimization includes material removal rate alongside tool wear depth and maximum chip length.
The material removal rate follows a theoretical relationship and does not require experimental regression modeling. The study expresses this relationship as follows.
max Vc = v · ap · f = π · d · n · ap · f = 131.88n · ap · f
Here, Vc represents material removal rate, n represents spindle speed, ap represents depth of cut, and f represents feed rate. The model combines theoretical material removal rate with the two BBD prediction models.
NSGA-II performs global multi-objective optimization to identify suitable cutting parameter combinations.
Multi-Objective Optimization Model
The optimization model contains design variables, objective functions, and constraints. Spindle speed, depth of cut, and feed rate serve as the three design variables.
The objectives include minimizing tool wear depth, minimizing maximum chip length, and maximizing material removal rate. Simulation results establish the corresponding constraints.
Tool wear depth must not exceed 0.02 mm, while maximum chip length must remain within 25 mm. The optimization model uses the following mathematical expression.
min F(X) = [Hw, Lc,max, −Vc]
100 ≤ n ≤ 300 r/min
0.5 ≤ ap ≤ 1.5 mm
0.05 ≤ f ≤ 0.15 mm/r
Hw ≤ 0.02 mm
Lc,max ≤ 25 mm
Maximizing material removal rate becomes minimizing its negative value, allowing all three objectives to share a minimization framework. This formulation represents the competing requirements of tool durability, chip evacuation, and machining efficiency.
The NSGA-II algorithm uses a population size of 100 and a maximum of 200 generations. Crossover probability is 0.9, while mutation probability is 0.01.
Pareto Optimization Results
The NSGA-II algorithm generates a Pareto solution set through global multi-objective optimization. During the first 50 generations, the average distance decreases rapidly, eliminating inferior parameter combinations.
After 150 generations, the distance approaches zero while showing slight fluctuations. By generation 200, it stabilizes near zero, indicating convergence toward the optimal Pareto frontier.
Figure 9 illustrates the three-dimensional distribution of the Pareto optimal solution set. The results reveal competing relationships among the three optimization objectives.
Higher material removal rates generally require greater tool wear, while lower wear often limits machining productivity. No single parameter combination simultaneously maximizes all three performance indicators.
Therefore, the study selects practical parameter combinations from the central region of the Pareto solution set.
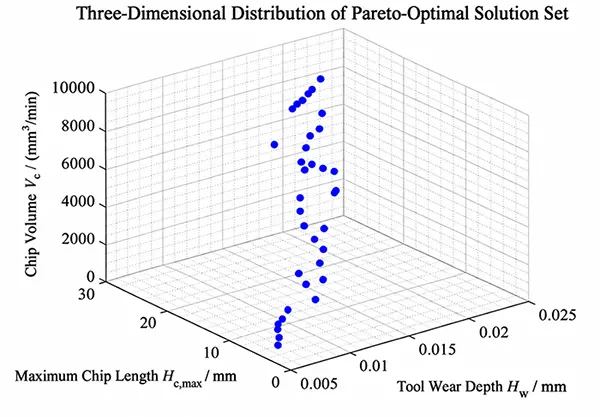
Ten representative nondominated solutions provide a quantitative comparison of the optimization results. Table 6 presents their cutting parameters and predicted performance indicators.
| No. | Spindle Speed n (r/min) | Depth of Cut ap (mm) | Feed Rate f (mm/r) | Tool Wear Depth Hw (mm) | Maximum Chip Length Lc,max (mm) | Material Removal Rate Vc (mm³/min) |
|---|---|---|---|---|---|---|
| 1 | 259.62 | 0.51 | 0.07 | 0.0067 | 5.85 | 1174.08 |
| 2 | 272.51 | 0.52 | 0.08 | 0.0082 | 6.96 | 1579.87 |
| 3 | 275.36 | 0.54 | 0.10 | 0.0099 | 8.24 | 1991.90 |
| 4 | 277.00 | 0.68 | 0.14 | 0.0157 | 14.24 | 3484.43 |
| 5 | 277.84 | 0.51 | 0.06 | 0.0061 | 3.91 | 1162.14 |
| 6 | 280.33 | 0.92 | 0.12 | 0.0177 | 23.62 | 4102.44 |
| 7 | 280.79 | 0.55 | 0.12 | 0.0117 | 8.69 | 2465.60 |
| 8 | 280.88 | 0.51 | 0.08 | 0.0077 | 5.66 | 1553.17 |
| 9 | 281.34 | 0.60 | 0.08 | 0.0092 | 9.72 | 1682.18 |
| 10 | 282.48 | 1.47 | 0.12 | 0.0195 | 27.98 | 6743.50 |
Table 6. Pareto Optimal Solution Set
The representative solutions demonstrate clear trade-offs among tool wear, chip length, and material removal rate. Different parameter combinations favor different machining objectives.
Experimental Verification
Selection of Optimized Cutting Parameters
Three cutting parameter combinations were selected from the NSGA-II Pareto optimal solution set for experimental verification. The algorithm produces continuous numerical solutions, but the CS6250 lathe uses stepped gear-driven spindle speeds.
Therefore, the researchers adjusted theoretical spindle speeds to the nearest available machine settings. Cutting depths were also rounded to practical adjustment increments.
Table 7 presents the three optimized parameter combinations and their corresponding chip morphology and evacuation performance.
| Group | Pareto Solution No. | Spindle Speed n (r/min) | Depth of Cut ap (mm) | Feed Rate f (mm/r) | Optimization Priority | Chip Morphology | Chip Evacuation Performance |
|---|---|---|---|---|---|---|---|
| 1 | 8 | 280 | 0.50 | 0.08 | Low Wear and Short Chips | Short C-shaped and Arc-Shaped Curled Chips | Smooth evacuation without tool entanglement or blockage |
| 2 | 2 | 270 | 0.50 | 0.08 | Balanced Performance | Ring-Shaped Curled Chips | Slight tool entanglement and minor localized accumulation |
| 3 | 4 | 280 | 0.70 | 0.14 | High Efficiency | Long Spiral Chips | Significant tool entanglement and obstructed chip evacuation |
Table 7. Evaluation of Chip Morphology and Chip Evacuation Performance Under Optimized Cutting Parameters
Chip Morphology and Evacuation Performance
Group 1 prioritizes low tool wear and short chips, with relatively low material removal volume. Group 2 balances the three optimization objectives, while Group 3 emphasizes machining efficiency.
Each parameter combination undergoes two trapezoidal groove machining experiments, with average values representing the final results. Figure 10 shows the corresponding chip morphologies.
Increasing cutting parameters changes chip morphology from short C-shaped and arc-shaped curls to ring-shaped and long spiral chips. Chip evacuation performance deteriorates progressively as cutting volume increases.
Group 1 produces short, easily evacuated chips without tool entanglement or blockage. Ring-shaped curls are generated by Group 2, with slight entanglement and localized accumulation.
Group 3 produces long spiral chips, causing significant entanglement and obstructed evacuation. These observations confirm the relationship between cutting conditions and chip formation.
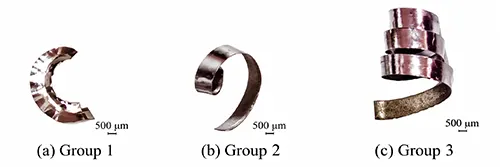
For P550 non-magnetic stainless steel, reducing cutting volume appropriately improves chip breaking and evacuation during deep-hole groove machining. Group 1 provides the best overall performance when chip morphology and evacuation are considered together.
The final optimized cutting parameters are 280 r/min spindle speed, 0.50 mm depth of cut, and 0.08 mm/r feed rate.
Machined Groove Quality
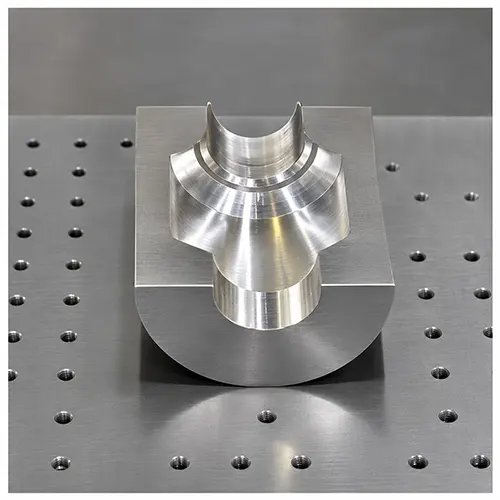
Figure 11 shows the trapezoidal groove after machining and axial sectioning. The groove has a clear, regular profile with consistent straightness and inclination.
No overcutting, undercutting, surface scratches, or burrs appear on the machined profile. Smooth transitions connect the groove walls and bottom, indicating good forming quality.
The machined surfaces also show uniform finish without obvious vibration marks. These characteristics satisfy the component’s design and functional requirements.
Dimensional Accuracy and Coordinate Measurement
Figure 12 presents the coordinate measurement process and reconstructed groove profile. A coordinate measuring machine collects point-cloud data from the machined hole.
Three-dimensional reconstruction enables evaluation of dimensional and geometric accuracy through diameter, roundness, and straightness errors.
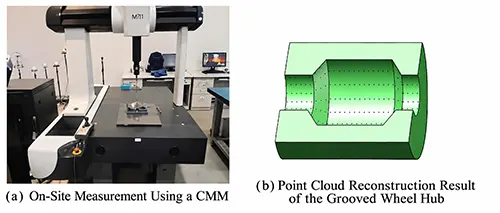
Measurement results show a trapezoidal groove diameter error below 0.15 mm, indicating good agreement with the design. Maximum cross-sectional roundness error reaches only 0.0142 mm.
The base-hole section has a straightness error of approximately 0.057 mm. These results demonstrate accurate groove formation and stable hole-axis alignment.
Straightness measurements confirm that the groove centerline shows no significant deviation from the original hole centerline. The variable-diameter tool maintains alignment despite its substantial overhang.
The results also verify the effectiveness of the multiple guide support blocks in suppressing tool-axis deviation.
Conclusion
The study developed a deep-hole internal annular groove machining system suitable for small-diameter holes requiring large radial expansion. The system coordinates radial tool movement, cutting operations, chip evacuation, and cooling.
Regression analysis identified depth of cut as the strongest factor affecting tool wear depth, followed by feed rate and spindle speed. The same ranking applies to maximum chip length.
Among parameter interactions, spindle speed and feed rate have the strongest influence on tool wear depth. Spindle speed and depth of cut exhibit the strongest relative interaction affecting maximum chip length.
Combining Box-Behnken response surface methodology with NSGA-II multi-objective optimization identified suitable cutting conditions. Experimental verification established 280 r/min spindle speed, 0.50 mm depth of cut, and 0.08 mm/r feed.
These parameters produce predominantly short C-shaped, arc-shaped, and segmented curled chips. Chip evacuation remains smooth without blockage or tool entanglement.
Dimensional inspection confirmed a groove diameter error below 0.15 mm, maximum roundness error of 0.0142 mm, and straightness error near 0.057 mm. The results demonstrate stable machining accuracy under long-overhang conditions.
The optimized machining system and cutting parameters provide a practical reference for precision manufacturing of complex internal annular grooves. They also support process development for difficult-to-machine materials and slender deep-hole components.