
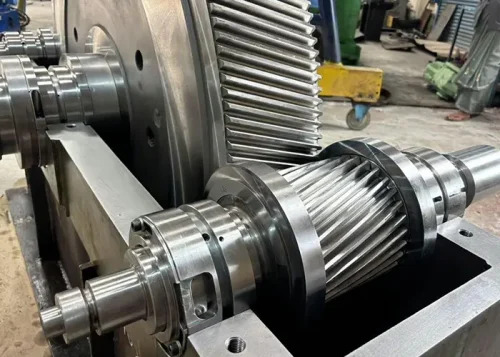

Against the backdrop of rapid development in the engine industry, the gear train—as a core component of power transmission—directly influences the engine’s overall efficiency and service life through its performance and reliability.
Tooth-side clearance, as a key parameter in gear design and manufacturing, has a significant impact on the transmission efficiency, operational stability, and noise control of the gear train.
Excessively small tooth-side clearance can lead to gear overheating and accelerated wear, while excessively large clearance can cause transmission shocks and increased noise, thereby affecting transmission accuracy.
Therefore, the precise control and detection of tooth-side clearance are of great significance for improving engine reliability.
Research on tooth-side clearance has continued uninterrupted.
Chen Wenhua et al. employed Monte Carlo simulation to analyze the transmission errors of cylindrical gear mechanisms;
Sun Tao et al. conducted a dimensional chain and dynamic analysis of gear systems incorporating tooth-side clearance based on CETOL;
Li Guangwei discussed methods for measuring tooth-side clearance; Chang Guoqiang et al. explored methods for measuring gear meshing clearance;
And Liu Lanlan et al. investigated the specification and detection of tooth-side clearance in cylindrical gear transmissions.
Current research has focused either on theoretical modeling and tolerance simulation analysis of flank clearance or on measurement methods for flank clearance;
However, researchers have not published reports on the integration of tolerance simulation and measurement of flank clearance;
This paper presents a theoretical model of tooth-side clearance, employs three-dimensional tolerance simulation analysis, and integrates it with tooth-side clearance measurement.
From the four dimensions of design, manufacturing, measurement, and assembly, it provides a systematic solution for optimizing tooth-side clearance.
Control of Flank Clearance
Definition and Influence of Gear Flank Clearance
In gear drives, flank clearance inevitably exists between meshing gear teeth due to errors in lubrication, manufacturing, machining, and installation, as well as wear that occurs during operation.
Flank clearance is the gap formed between the non-meshing tooth surfaces of two mating gears when their meshing tooth surfaces come into contact.
Flank clearance has a significant impact on gear transmission systems; If set improperly, it may lead to tooth chipping and, in severe cases, cause noise issues.
Therefore, it is crucial to control the magnitude of flank clearance during the assembly of gear systems.
3D Tolerance Analysis Strategy for Gear Flank Clearance
Engineers build models in Creo and run calculations with 3D tolerance analysis software.
They incorporate real machining deviations into the evaluation. They regard flank clearance as one closed loop inside the gear dimensional chain.
This setup supports 3D tolerance analysis for the gear system. The analysis outputs the contribution of each tolerance variable. Designers revise part dimensions or tolerance values according to these results.
These revisions optimize the tooth flank clearance. The method offers a quality-control strategy for gear systems at the detailed design stage.
Principle and Advantages of the Monte Carlo Method
Currently, the Monte Carlo method is generally used in the calculation process of three-dimensional tolerance analysis.
The Monte Carlo method follows a core logic. It targets problems related to random event probability or the expected value of random variables.
Researchers run simulation trials for these random processes. They estimate event probability from observed occurrence frequencies.
They also extract numerical features of the random variables. These statistical results serve as the final solution. We find this method well-suited for simulating the assembly process of parts under conditions of mass production.
Under certain conditions, the results obtained using this method are relatively consistent with actual circumstances.
Compared to other methods, the Monte Carlo method can handle various complex problems (such as spatial dimensional chains and nonlinear dimensional chains), has a wide range of applications, and yields accurate results.
Functions and Analysis Procedure of 3D Tolerance Simulation Software
3D tolerance simulation software adopts mathematical and statistical algorithms. This tool performs simulation and analysis on assembly tolerance chains.
It evaluates manufacturing deviations of components across design and production phases. The software also assesses how assembly strategies affect assembly outcomes.
These factors collectively alter critical product characteristics. Designers can obtain quantitative results of these effects from the software.
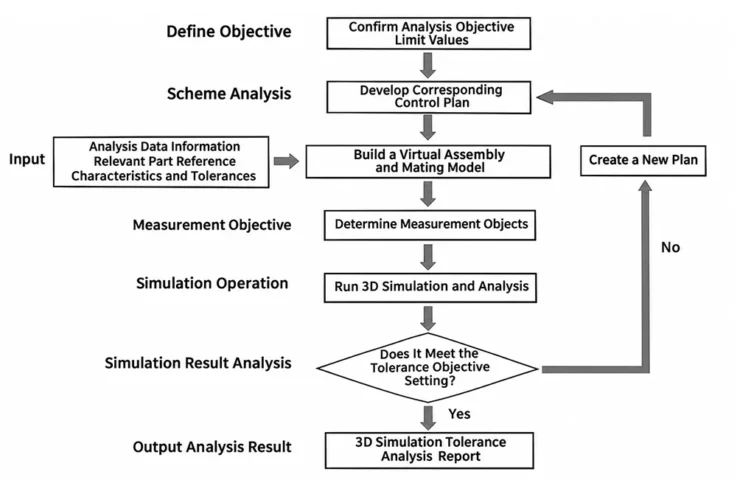
The specific analysis workflow is shown in Figure 1.
Research Object and Assembly Relationship
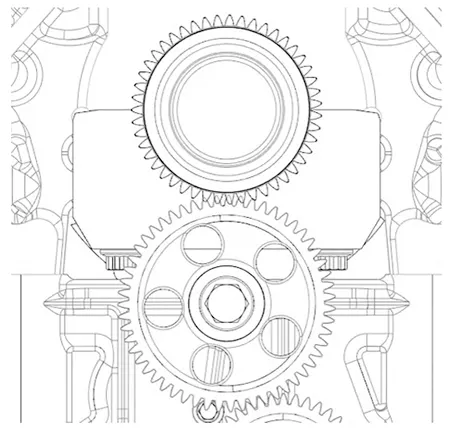
Based on the above tolerance analysis theory, we conducted a tolerance analysis on the normal clearance between the crankshaft gear and the intermediate gear of the oil pump in a certain engine.
The components related to the tooth-side clearance consist of the engine block, crankshaft, main bearing shells, crankshaft gear, and oil pump assembly (including the intermediate gear shaft, intermediate gear, and oil pump locating pin) .
The crankshaft gear is interference-fit onto the crankshaft and mounted to the engine block via the main bearing shells;
Workers pre-assemble the intermediate gear and intermediate gear shaft into a complete oil pump unit. They fasten this assembly onto the crankcase with oil pump locating pins.
This mounting method maintains the qualified working clearance between the crankshaft gear and the oil pump intermediate gear. Figure 2 illustrates this assembly layout.
3D Tolerance Software Analysis Process
Convert the Creo 3D model into a compatible format, import the tooth-side clearance analysis model, and add relevant part reference features and tolerances based on the actual constraints of the components;
After adding the features, perform a virtual assembly of the features and between features in the order of the constraints;
During assembly, ensure that the crankshaft main journal contacts the underside of the main bearing shell, and that the oil pump intermediate gear contacts the working surface of the crankshaft gear;
After the virtual assembly is complete, set the distribution type to normal distribution and set the machining process level for each component to 3σ;
Select points on the non-working surfaces of the crankshaft gear and the oil pump’s intermediate gear, perform measurements, and use the measured values as the normal clearance.
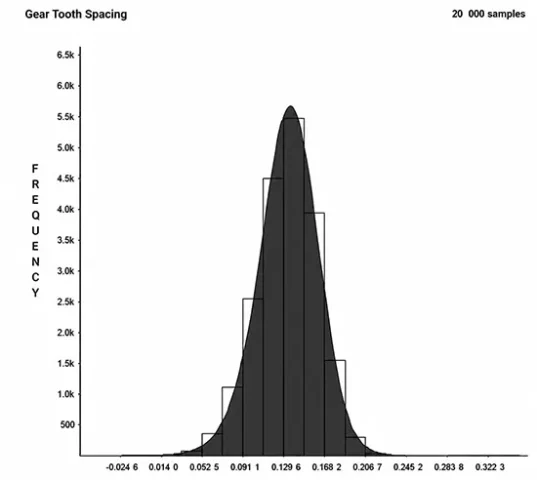
The model underwent 20,000 virtual assembly simulations with a confidence interval probability of 99.73%.
Through 20,000 Monte Carlo simulations, we obtained the statistical distribution of the tooth-side clearance, as shown in Figure 3.
The ranking of the contribution levels of the major contributing factors is shown in Table 1.
| Contributing Factor | Contribution (%) |
|---|---|
| Positional Accuracy of the Main Spindle Bearing Bore in the Machine Housing | 44.08 |
| Positional Accuracy of the Intermediate Gear Shaft Mounting Hole in the Oil Pump | 20.68 |
| Intermediate Gear Tooth Groove of the Oil Pump | 12.83 |
| Crankshaft Gear Tooth Thickness | 8.74 |
Table 1. Ranking of Key Factors by Contribution
We rank key factors by their tolerance contribution. Two strategies can control the tooth flank clearance.
The first strategy optimizes center distance. Designers tighten positional tolerances for the main bearing bore and intermediate gear shaft bore.
The second strategy adopts tooth profile modification. Engineers adjust tooth thickness and tooth groove tolerance zones.
They set these adjustments according to each factor’s contribution weight.
Measurement of Tooth-Side Clearance
Tooth-side clearance can be classified into circumferential side clearance (jwt), normal side clearance (jbn), and radial side clearance (jr).
Commonly used measurement methods include the dial gauge method, the lead wire method, and the feeler gauge method.
Currently, the engine industry faces prominent issues such as inappropriate selection of measurement methods, non-standardized operations, and insufficient accuracy control;
These lead to significant measurement errors, which affect gear transmission performance and engine quality.
This paper will elaborate in detail on the definitions, measurement principles, and interrelationships of these three types of tooth-flank clearances.
This work also considers the practical demands of engine production lines. It delivers an integrated improvement scheme.
The scheme includes optimized inspection methods and standardized operating procedures.
These changes raise measurement accuracy and testing speed. They sustain consistent product quality in mass production.
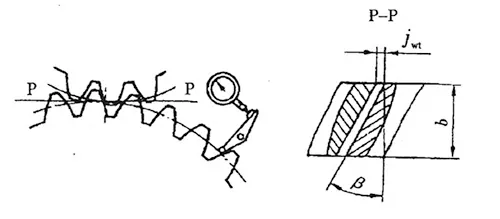
Circumferential Backlash (jwt)
Circumferential backlash jwt (Fig. 4) is determined by fixing one of the meshing gears in place, positioning a dial indicator or micrometer tangentially to the pitch circle of the other gear, and wiggling that gear to bring the non-working tooth surfaces of the two gears into contact.
The difference in readings on the dial indicator or micrometer is the circumferential backlash, as shown in Figure 4.
We obtain direct readings, high measurement accuracy and good repeatability with the dial indicator method, though the available operating space restricts this approach.
Normal Clearance (jbn)
Normal clearance jbn (Fig. 5) is the shortest distance between the non-working surfaces of two gears when their working surfaces are in mesh.
We can measure it using a feeler gauge (Fig. 5).
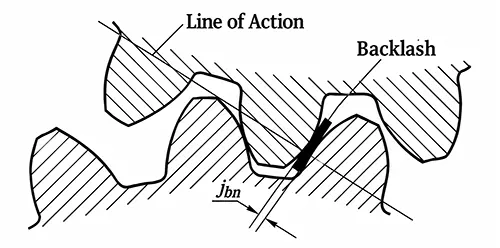
This method delivers direct measurement results and is simple to perform.
However, we need multiple test runs and must adjust the feeler gauge to the appropriate tightness.
We can also measure it using the lead wire method.
This method does not produce direct readings; instead, we calculate the clearance indirectly by measuring the thickness of the lead wire.
We find this approach easy to implement and especially convenient under limited working space, yet the lead wire diameter affects its accuracy.
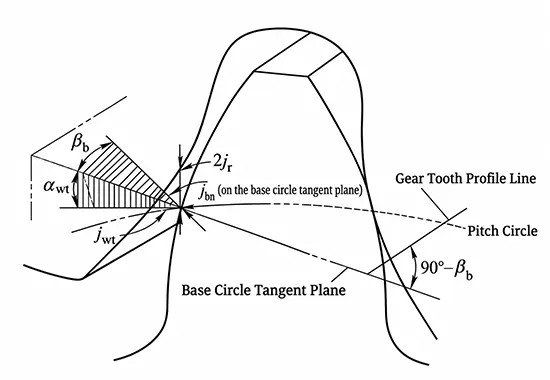
Equation (1) defines its relationship with the circumferential clearance jwt:

In the equation, αwt is the pressure angle at the end face; βb is the helix angle of the base circle.
Radial Clearance (jr)
We define the radial clearance jr (Fig. 6) as the distance that reduces the center distance between two meshing gears until the left and right gear faces contact one another; this reduction equals the radial clearance.
The relationship is expressed by Equation (2):

The feeler gauge method is not suitable for engine production lines because it is cumbersome to operate and highly susceptible to human error;
While the dial gauge method, although highly accurate, is limited by the available operating space.
This paper focuses on the relationship between tooth-side clearance and wire diameter.
Through theoretical analysis and experimental verification, it explores measurement methods more suitable for engine production lines to improve measurement efficiency and accuracy and ensure stable product quality.
Theoretical Study of the Lead Wire Compression Method
The lead wire compression method enables indirect measurement of mesial space based on the principles of plastic deformation of materials and the law of conservation of volume.
The principle is as follows: we place a lead wire on the non-working tooth surface of a gear pair;
We apply pressure by rotating the gears to induce compressive deformation;
And we measure the thickness of the deformed lead wire to calculate the tooth-side clearance value.
The theoretical basis and formula derivations for this method are as follows.
1. Assumption of Conservation of Volume
Assume that the axial length (L) of the lead wire remains constant during the compression process, and only lateral expansion occurs.
We compress the lead wire into a rectangular prism. The volume of the cylinder before compression equals the volume of the rectangular prism after compression.
The volume of the lead wire before compression is given by Equation (3):

In the equation, D is the initial diameter of the lead wire; L is the length of the lead wire (assumed to be constant).
The volume of the lead wire after compression is given by Equation (4):

In the equation, t represents the thickness after compression; w represents the width after compression.
Based on the principle of conservation of volume, V_(before) = V_(after), the width after compression is derived as shown in Equation (5):

2. Yield Strength Constraint
When the lead wire undergoes plastic deformation, the pressure must overcome the material’s yield strength σy and satisfy Equation (6):

In this equation, F is the compressive force; A is the post-compression cross-sectional area; and σy is the yield strength of the lead wire.
Equations (5) and (6) yield Equation (7):

Based on the results derived from Equation (7), it follows that the inter-tooth gap (i.e., the compressed thickness t) is directly proportional to the square of the lead wire diameter D;
Therefore, the choice of lead wire diameter directly affects measurement accuracy.
Experimental Validation of the Lead Wire Method
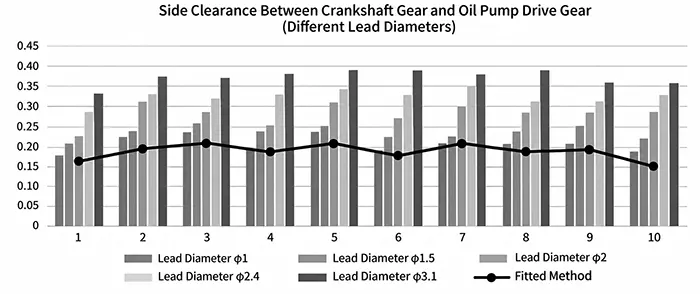
To validate the theoretical model and investigate the relationship between lead wire diameter (D) and meshing clearance (t), the experiment used lead wires of five different diameters—Ø1 mm, Ø1.5 mm, Ø2 mm, Ø2.4 mm, and Ø3.1 mm—to perform repeated measurements on the same gear pair. Key control measures included the following aspects:
(1) Standardized operations:We performed all measurements with the same inspector to eliminate human operational variations;
(2) Consistency in gear rotation: We used an electric gear-rotation device to drive the gear train and avoid fluctuations in rotational speed and applied force caused by manual rotation;
(3) Measurement repeatability: On a fixed gear pair from the same engine, mark four measurement positions and simultaneously perform comparative measurements using both the dial gauge method (reference standard) and the lead wire compression method to ensure data reproducibility;
(4) Sample representativeness: Repeat the above process across multiple engines to obtain a sufficiently large sample size;
(5) Control of lead wire deformation: Measure the thickness of the compressed lead wire using a vernier caliper to avoid errors caused by plastic deformation resulting from the micrometer’s clamping force.
The comparison of experimental data is shown in Figure 7, and the experimental conclusions are as follows:
1. Method Comparison
The tooth-side clearance values measured using the lead wire compression method are generally higher than those obtained using the dial indicator method;
This difference stems from the compression and rebound of the lead wire, as well as systematic errors in the measuring tools
2. Effect of Diameter
The mesial clearance tends to increase with an increase in lead wire diameter;
However, an excessively large diameter (e.g., Ø3.1 mm) can easily cause gear misalignment, leading to distorted measurement values;
The recommended lead wire diameter range is 2 to 4 times the maximum tooth-side clearance.
Conclusion
This study conducts a systematic investigation into the control and measurement methods for flank clearance in engine gear pairs.
By combining three-dimensional tolerance simulation analysis with experimental validation, it proposes a comprehensive solution covering the entire process from design optimization to assembly inspection.
The main conclusions are as follows.
Optimization of Tooth-Side Clearance Control
Three-dimensional tolerance simulation based on the Monte Carlo method indicates that tooth-side clearance is primarily influenced by center distance tolerance (64.76% contribution) and tooth profile parameter tolerance (21.57% contribution);
Engineers tighten the positional tolerance of the main bearing bore and intermediate gear shaft bore.
This change stabilizes the accuracy of the gear center distance. They also revise the tolerance bands for tooth thickness and tooth root depth.
These adjustments greatly raise the pass rate of tooth flank clearance. They effectively lower the risk of interference during gear meshing.
Methods for Measuring Tooth-Side Clearance
We recommend the dial gauge method as the preferred measurement method when operating space permits, because it delivers high accuracy and good repeatability;
We may adopt the lead-wire compression method if operating space is limited. The lead-wire diameter strongly influences the measurement accuracy of this method;
It is recommended to keep the lead-wire diameter within 2 to 4 times the maximum designed tooth-side clearance to ensure the accuracy and reliability of the measurement results.
Standardization of the Lead Wire Compression Method
Theoretical derivations and experimental verification show that the tooth-side clearance (t) and the lead wire diameter (D) satisfy the relationship t ∝ D².
By standardizing experimental procedures and operational guidelines, we can effectively improve the measurement accuracy of the lead wire compression method and provide scientific guidance for actual production.
This study combines tolerance simulation with measurement method optimization to establish a closed-loop control system for tooth-side clearance encompassing “design–manufacturing–measurement–assembly.”
It provides both a theoretical basis and practical guidelines for the high-precision assembly of engine gear pairs, which can significantly improve the stability of the transmission system and reduce the risks of noise and wear.